Compare commits
1 Commits
v1.0-Build
...
master
| Author | SHA1 | Date | |
|---|---|---|---|
|
|
929221c9af |
1
Podfile
1
Podfile
@@ -18,6 +18,7 @@ target 'pocloud' do
|
||||
pod 'Firebase/Database'
|
||||
pod 'Firebase/Auth'
|
||||
pod 'SideMenu'
|
||||
pod 'Charts'
|
||||
|
||||
end
|
||||
|
||||
|
||||
28
Podfile.lock
28
Podfile.lock
@@ -3,6 +3,9 @@ PODS:
|
||||
- ChameleonFramework (2.1.0):
|
||||
- ChameleonFramework/Default (= 2.1.0)
|
||||
- ChameleonFramework/Default (2.1.0)
|
||||
- Charts (3.1.1):
|
||||
- Charts/Core (= 3.1.1)
|
||||
- Charts/Core (3.1.1)
|
||||
- Firebase/Auth (5.2.0):
|
||||
- Firebase/CoreOnly
|
||||
- FirebaseAuth (= 5.0.1)
|
||||
@@ -40,15 +43,15 @@ PODS:
|
||||
- nanopb/encode (= 0.3.8)
|
||||
- nanopb/decode (0.3.8)
|
||||
- nanopb/encode (0.3.8)
|
||||
- PromiseKit/Alamofire (6.2.8):
|
||||
- PromiseKit/Alamofire (6.3.0):
|
||||
- Alamofire (~> 4.0)
|
||||
- PromiseKit/CorePromise
|
||||
- PromiseKit/CorePromise (6.2.8)
|
||||
- Realm (3.7.0):
|
||||
- Realm/Headers (= 3.7.0)
|
||||
- Realm/Headers (3.7.0)
|
||||
- RealmSwift (3.7.0):
|
||||
- Realm (= 3.7.0)
|
||||
- PromiseKit/CorePromise (6.3.0)
|
||||
- Realm (3.7.1):
|
||||
- Realm/Headers (= 3.7.1)
|
||||
- Realm/Headers (3.7.1)
|
||||
- RealmSwift (3.7.1):
|
||||
- Realm (= 3.7.1)
|
||||
- SideMenu (4.0.0)
|
||||
- SVProgressHUD (2.2.5)
|
||||
- SwiftChart (1.0.1)
|
||||
@@ -57,6 +60,7 @@ PODS:
|
||||
DEPENDENCIES:
|
||||
- Alamofire
|
||||
- ChameleonFramework
|
||||
- Charts
|
||||
- Firebase/Auth
|
||||
- Firebase/Core
|
||||
- Firebase/Database
|
||||
@@ -72,6 +76,7 @@ SPEC REPOS:
|
||||
https://github.com/cocoapods/specs.git:
|
||||
- Alamofire
|
||||
- ChameleonFramework
|
||||
- Charts
|
||||
- Firebase
|
||||
- FirebaseAnalytics
|
||||
- FirebaseAuth
|
||||
@@ -94,6 +99,7 @@ SPEC REPOS:
|
||||
SPEC CHECKSUMS:
|
||||
Alamofire: e4fa87002c137ba2d8d634d2c51fabcda0d5c223
|
||||
ChameleonFramework: d21a3cc247abfe5e37609a283a8238b03575cf64
|
||||
Charts: 90a4d61da0f6e06684c591e3bcab11940fe61736
|
||||
Firebase: 25ed0412036d7d008568d1fb4d2e9d81ea8a0a2c
|
||||
FirebaseAnalytics: b3628aea54c50464c32c393fb2ea032566e7ecc2
|
||||
FirebaseAuth: 463b8ce33bd5d05f706dcd4615499e3212b4132b
|
||||
@@ -105,14 +111,14 @@ SPEC CHECKSUMS:
|
||||
Kingfisher: 976d828df2b24834c6a3f2fc4d82cdbd26552be1
|
||||
leveldb-library: 08cba283675b7ed2d99629a4bc5fd052cd2bb6a5
|
||||
nanopb: 5601e6bca2dbf1ed831b519092ec110f66982ca3
|
||||
PromiseKit: 6788ce1a0ed5448b83d4aaf56b9fc49fb7647d32
|
||||
Realm: 4998c6ced1ea15b3792f273b18f8e6faaf935b5c
|
||||
RealmSwift: 7dc2ab780b9742a1fc7469b2e4776b9773e2e825
|
||||
PromiseKit: cf84bbb1235a61473b326c5cf0b41f6828f87ba5
|
||||
Realm: 906be37d52f17f25484ac01643a7f26a9d3bfbd5
|
||||
RealmSwift: 1c2b6bae3dc55bb87e080ffa96537d71442f6dce
|
||||
SideMenu: 70ee5657df63ec3382660ec4ef470bf1cf5db07d
|
||||
SVProgressHUD: 1428aafac632c1f86f62aa4243ec12008d7a51d6
|
||||
SwiftChart: ba767a678d568a5ee22d419e146a0582865e1aff
|
||||
SwiftyJSON: c29297daf073d2aa016295d5809cdd68045c39b3
|
||||
|
||||
PODFILE CHECKSUM: f920b0139378aa95335e4e152b9daa8cfaf65705
|
||||
PODFILE CHECKSUM: 36ed7324164643785df43e440238496dcacc4f53
|
||||
|
||||
COCOAPODS: 1.5.3
|
||||
|
||||
202
Pods/Charts/LICENSE
generated
Normal file
202
Pods/Charts/LICENSE
generated
Normal file
@@ -0,0 +1,202 @@
|
||||
Apache License
|
||||
Version 2.0, January 2004
|
||||
http://www.apache.org/licenses/
|
||||
|
||||
TERMS AND CONDITIONS FOR USE, REPRODUCTION, AND DISTRIBUTION
|
||||
|
||||
1. Definitions.
|
||||
|
||||
"License" shall mean the terms and conditions for use, reproduction,
|
||||
and distribution as defined by Sections 1 through 9 of this document.
|
||||
|
||||
"Licensor" shall mean the copyright owner or entity authorized by
|
||||
the copyright owner that is granting the License.
|
||||
|
||||
"Legal Entity" shall mean the union of the acting entity and all
|
||||
other entities that control, are controlled by, or are under common
|
||||
control with that entity. For the purposes of this definition,
|
||||
"control" means (i) the power, direct or indirect, to cause the
|
||||
direction or management of such entity, whether by contract or
|
||||
otherwise, or (ii) ownership of fifty percent (50%) or more of the
|
||||
outstanding shares, or (iii) beneficial ownership of such entity.
|
||||
|
||||
"You" (or "Your") shall mean an individual or Legal Entity
|
||||
exercising permissions granted by this License.
|
||||
|
||||
"Source" form shall mean the preferred form for making modifications,
|
||||
including but not limited to software source code, documentation
|
||||
source, and configuration files.
|
||||
|
||||
"Object" form shall mean any form resulting from mechanical
|
||||
transformation or translation of a Source form, including but
|
||||
not limited to compiled object code, generated documentation,
|
||||
and conversions to other media types.
|
||||
|
||||
"Work" shall mean the work of authorship, whether in Source or
|
||||
Object form, made available under the License, as indicated by a
|
||||
copyright notice that is included in or attached to the work
|
||||
(an example is provided in the Appendix below).
|
||||
|
||||
"Derivative Works" shall mean any work, whether in Source or Object
|
||||
form, that is based on (or derived from) the Work and for which the
|
||||
editorial revisions, annotations, elaborations, or other modifications
|
||||
represent, as a whole, an original work of authorship. For the purposes
|
||||
of this License, Derivative Works shall not include works that remain
|
||||
separable from, or merely link (or bind by name) to the interfaces of,
|
||||
the Work and Derivative Works thereof.
|
||||
|
||||
"Contribution" shall mean any work of authorship, including
|
||||
the original version of the Work and any modifications or additions
|
||||
to that Work or Derivative Works thereof, that is intentionally
|
||||
submitted to Licensor for inclusion in the Work by the copyright owner
|
||||
or by an individual or Legal Entity authorized to submit on behalf of
|
||||
the copyright owner. For the purposes of this definition, "submitted"
|
||||
means any form of electronic, verbal, or written communication sent
|
||||
to the Licensor or its representatives, including but not limited to
|
||||
communication on electronic mailing lists, source code control systems,
|
||||
and issue tracking systems that are managed by, or on behalf of, the
|
||||
Licensor for the purpose of discussing and improving the Work, but
|
||||
excluding communication that is conspicuously marked or otherwise
|
||||
designated in writing by the copyright owner as "Not a Contribution."
|
||||
|
||||
"Contributor" shall mean Licensor and any individual or Legal Entity
|
||||
on behalf of whom a Contribution has been received by Licensor and
|
||||
subsequently incorporated within the Work.
|
||||
|
||||
2. Grant of Copyright License. Subject to the terms and conditions of
|
||||
this License, each Contributor hereby grants to You a perpetual,
|
||||
worldwide, non-exclusive, no-charge, royalty-free, irrevocable
|
||||
copyright license to reproduce, prepare Derivative Works of,
|
||||
publicly display, publicly perform, sublicense, and distribute the
|
||||
Work and such Derivative Works in Source or Object form.
|
||||
|
||||
3. Grant of Patent License. Subject to the terms and conditions of
|
||||
this License, each Contributor hereby grants to You a perpetual,
|
||||
worldwide, non-exclusive, no-charge, royalty-free, irrevocable
|
||||
(except as stated in this section) patent license to make, have made,
|
||||
use, offer to sell, sell, import, and otherwise transfer the Work,
|
||||
where such license applies only to those patent claims licensable
|
||||
by such Contributor that are necessarily infringed by their
|
||||
Contribution(s) alone or by combination of their Contribution(s)
|
||||
with the Work to which such Contribution(s) was submitted. If You
|
||||
institute patent litigation against any entity (including a
|
||||
cross-claim or counterclaim in a lawsuit) alleging that the Work
|
||||
or a Contribution incorporated within the Work constitutes direct
|
||||
or contributory patent infringement, then any patent licenses
|
||||
granted to You under this License for that Work shall terminate
|
||||
as of the date such litigation is filed.
|
||||
|
||||
4. Redistribution. You may reproduce and distribute copies of the
|
||||
Work or Derivative Works thereof in any medium, with or without
|
||||
modifications, and in Source or Object form, provided that You
|
||||
meet the following conditions:
|
||||
|
||||
(a) You must give any other recipients of the Work or
|
||||
Derivative Works a copy of this License; and
|
||||
|
||||
(b) You must cause any modified files to carry prominent notices
|
||||
stating that You changed the files; and
|
||||
|
||||
(c) You must retain, in the Source form of any Derivative Works
|
||||
that You distribute, all copyright, patent, trademark, and
|
||||
attribution notices from the Source form of the Work,
|
||||
excluding those notices that do not pertain to any part of
|
||||
the Derivative Works; and
|
||||
|
||||
(d) If the Work includes a "NOTICE" text file as part of its
|
||||
distribution, then any Derivative Works that You distribute must
|
||||
include a readable copy of the attribution notices contained
|
||||
within such NOTICE file, excluding those notices that do not
|
||||
pertain to any part of the Derivative Works, in at least one
|
||||
of the following places: within a NOTICE text file distributed
|
||||
as part of the Derivative Works; within the Source form or
|
||||
documentation, if provided along with the Derivative Works; or,
|
||||
within a display generated by the Derivative Works, if and
|
||||
wherever such third-party notices normally appear. The contents
|
||||
of the NOTICE file are for informational purposes only and
|
||||
do not modify the License. You may add Your own attribution
|
||||
notices within Derivative Works that You distribute, alongside
|
||||
or as an addendum to the NOTICE text from the Work, provided
|
||||
that such additional attribution notices cannot be construed
|
||||
as modifying the License.
|
||||
|
||||
You may add Your own copyright statement to Your modifications and
|
||||
may provide additional or different license terms and conditions
|
||||
for use, reproduction, or distribution of Your modifications, or
|
||||
for any such Derivative Works as a whole, provided Your use,
|
||||
reproduction, and distribution of the Work otherwise complies with
|
||||
the conditions stated in this License.
|
||||
|
||||
5. Submission of Contributions. Unless You explicitly state otherwise,
|
||||
any Contribution intentionally submitted for inclusion in the Work
|
||||
by You to the Licensor shall be under the terms and conditions of
|
||||
this License, without any additional terms or conditions.
|
||||
Notwithstanding the above, nothing herein shall supersede or modify
|
||||
the terms of any separate license agreement you may have executed
|
||||
with Licensor regarding such Contributions.
|
||||
|
||||
6. Trademarks. This License does not grant permission to use the trade
|
||||
names, trademarks, service marks, or product names of the Licensor,
|
||||
except as required for reasonable and customary use in describing the
|
||||
origin of the Work and reproducing the content of the NOTICE file.
|
||||
|
||||
7. Disclaimer of Warranty. Unless required by applicable law or
|
||||
agreed to in writing, Licensor provides the Work (and each
|
||||
Contributor provides its Contributions) on an "AS IS" BASIS,
|
||||
WITHOUT WARRANTIES OR CONDITIONS OF ANY KIND, either express or
|
||||
implied, including, without limitation, any warranties or conditions
|
||||
of TITLE, NON-INFRINGEMENT, MERCHANTABILITY, or FITNESS FOR A
|
||||
PARTICULAR PURPOSE. You are solely responsible for determining the
|
||||
appropriateness of using or redistributing the Work and assume any
|
||||
risks associated with Your exercise of permissions under this License.
|
||||
|
||||
8. Limitation of Liability. In no event and under no legal theory,
|
||||
whether in tort (including negligence), contract, or otherwise,
|
||||
unless required by applicable law (such as deliberate and grossly
|
||||
negligent acts) or agreed to in writing, shall any Contributor be
|
||||
liable to You for damages, including any direct, indirect, special,
|
||||
incidental, or consequential damages of any character arising as a
|
||||
result of this License or out of the use or inability to use the
|
||||
Work (including but not limited to damages for loss of goodwill,
|
||||
work stoppage, computer failure or malfunction, or any and all
|
||||
other commercial damages or losses), even if such Contributor
|
||||
has been advised of the possibility of such damages.
|
||||
|
||||
9. Accepting Warranty or Additional Liability. While redistributing
|
||||
the Work or Derivative Works thereof, You may choose to offer,
|
||||
and charge a fee for, acceptance of support, warranty, indemnity,
|
||||
or other liability obligations and/or rights consistent with this
|
||||
License. However, in accepting such obligations, You may act only
|
||||
on Your own behalf and on Your sole responsibility, not on behalf
|
||||
of any other Contributor, and only if You agree to indemnify,
|
||||
defend, and hold each Contributor harmless for any liability
|
||||
incurred by, or claims asserted against, such Contributor by reason
|
||||
of your accepting any such warranty or additional liability.
|
||||
|
||||
END OF TERMS AND CONDITIONS
|
||||
|
||||
APPENDIX: How to apply the Apache License to your work.
|
||||
|
||||
To apply the Apache License to your work, attach the following
|
||||
boilerplate notice, with the fields enclosed by brackets "{}"
|
||||
replaced with your own identifying information. (Don't include
|
||||
the brackets!) The text should be enclosed in the appropriate
|
||||
comment syntax for the file format. We also recommend that a
|
||||
file or class name and description of purpose be included on the
|
||||
same "printed page" as the copyright notice for easier
|
||||
identification within third-party archives.
|
||||
|
||||
Copyright 2016 Daniel Cohen Gindi & Philipp Jahoda
|
||||
|
||||
Licensed under the Apache License, Version 2.0 (the "License");
|
||||
you may not use this file except in compliance with the License.
|
||||
You may obtain a copy of the License at
|
||||
|
||||
http://www.apache.org/licenses/LICENSE-2.0
|
||||
|
||||
Unless required by applicable law or agreed to in writing, software
|
||||
distributed under the License is distributed on an "AS IS" BASIS,
|
||||
WITHOUT WARRANTIES OR CONDITIONS OF ANY KIND, either express or implied.
|
||||
See the License for the specific language governing permissions and
|
||||
limitations under the License.
|
||||
|
||||
212
Pods/Charts/README.md
generated
Normal file
212
Pods/Charts/README.md
generated
Normal file
@@ -0,0 +1,212 @@
|
||||
**Version 3.1.1**, synced to [MPAndroidChart #f6a398b](https://github.com/PhilJay/MPAndroidChart/commit/f6a398b)
|
||||
|
||||

|
||||
 [](https://github.com/danielgindi/Charts/releases) [](http://cocoapods.org/pods/charts) [](https://github.com/Carthage/Carthage) [](https://travis-ci.org/danielgindi/Charts) [](https://codecov.io/gh/danielgindi/Charts)
|
||||
[](https://gitter.im/danielgindi/Charts?utm_source=badge&utm_medium=badge&utm_campaign=pr-badge&utm_content=badge)
|
||||
|
||||
### Just a heads up: Charts 3.0 has some breaking changes. Please read [the release/migration notes](https://github.com/danielgindi/Charts/releases/tag/v3.0.0).
|
||||
### Another heads up: ChartsRealm is now in a [separate repo](https://github.com/danielgindi/ChartsRealm). Pods is also now `Charts` and `ChartsRealm`, instead of ~`Charts/Core`~ and ~`Charts/Realm`~
|
||||
|
||||
* Xcode 9.3 / Swift 4.1
|
||||
* iOS >= 8.0 (Use as an **Embedded** Framework)
|
||||
* tvOS >= 9.0
|
||||
* macOS >= 10.11
|
||||
|
||||
Okay so there's this beautiful library called [MPAndroidChart](https://github.com/PhilJay/MPAndroidChart) by [Philipp Jahoda](https://www.linkedin.com/in/philippjahoda) which has become very popular amongst Android developers, and in the meanwhile there's no decent charting solution for iOS.
|
||||
|
||||
I've chosen to write it in `Swift` as it can be highly optimized by the compiler, and can be used in both `Swift` and `ObjC` project. The demo project is written in `ObjC` to demonstrate how it works.
|
||||
|
||||
**An amazing feature** of this library now, for Android, iOS, tvOS and macOS, is the time it saves you when developing for both platforms, as the learning curve is singleton- it happens only once, and the code stays very similar so developers don't have to go around and re-invent the app to produce the same output with a different library. (And that's not even considering the fact that there's not really another good choice out there currently...)
|
||||
|
||||
## Having trouble running the demo?
|
||||
|
||||
* `ChartsDemo/ChartsDemo.xcodeproj` is the demo project for iOS/tvOS
|
||||
* `ChartsDemo-OSX/ChartsDemo-OSX.xcodeproj` is the demo project for macOS
|
||||
* Make sure you are running a supported version of Xcode.
|
||||
* Usually it is specified here a few lines above.
|
||||
* In most cases it will be the latest Xcode version.
|
||||
* Make sure that your project supports Swift 3.0
|
||||
* Optional: Run `carthage checkout` in the project folder, to fetch dependencies (i.e testing dependencies).
|
||||
* If you don't have Carthage - you can get it [here](https://github.com/Carthage/Carthage/releases).
|
||||
|
||||
|
||||
## Usage
|
||||
|
||||
In order to correctly compile:
|
||||
|
||||
1. Drag the `Charts.xcodeproj` to your project
|
||||
2. Go to your target's settings, hit the "+" under the "Embedded Binaries" section, and select the Charts.framework
|
||||
3. `@import Charts`
|
||||
4. When using Swift in an ObjC project:
|
||||
- You need to import your Bridging Header. Usually it is "*YourProject-Swift.h*", so in ChartsDemo it's "*ChartsDemo-Swift.h*". Do not try to actually include "*ChartsDemo-Swift.h*" in your project :-)
|
||||
- (Xcode 8.1 and earlier) Under "Build Options", mark "Embedded Content Contains Swift Code"
|
||||
- (Xcode 8.2+) Under "Build Options", mark "Always Embed Swift Standard Libraries"
|
||||
5. When using [Realm.io](https://realm.io/):
|
||||
- Note that the Realm framework is not linked with Charts - it is only there for *optional* bindings. Which means that you need to have the framework in your project, and in a compatible version to whatever is compiled with Charts. We will do our best to always compile against the latest version.
|
||||
- You'll need to add `ChartsRealm` as a dependency too.
|
||||
|
||||
## 3rd party tutorials
|
||||
|
||||
* [Using Realm and Charts with Swift 3 in iOS 10 (Sami Korpela)](https://medium.com/@skoli/using-realm-and-charts-with-swift-3-in-ios-10-40c42e3838c0#.2gyymwfh8)
|
||||
* [Creating a Line Chart in Swift 3 and iOS 10 (Osian Smith)](https://medium.com/@OsianSmith/creating-a-line-chart-in-swift-3-and-ios-10-2f647c95392e)
|
||||
* [Beginning Set-up and Example Using Charts with Swift 3](https://github.com/annalizhaz/ChartsForSwiftBasic)
|
||||
* Want your tutorial to show here? Create a PR!
|
||||
|
||||
## Troubleshooting
|
||||
|
||||
#### Can't compile?
|
||||
|
||||
* Please note the difference between installing a compiled framework from CocoaPods or Carthage, and copying the source code.
|
||||
* Please read the **Usage** section again.
|
||||
* Search in the issues
|
||||
* Try to politely ask in the issues section
|
||||
|
||||
#### Other problems / feature requests
|
||||
|
||||
* Search in the issues
|
||||
* Try to politely ask in the issues section
|
||||
|
||||
## CocoaPods Install
|
||||
|
||||
Add `pod 'Charts'` to your Podfile. "Charts" is the name of the library.
|
||||
For [Realm](https://realm.io/) support, please add `pod 'ChartsRealm'` too.
|
||||
|
||||
**Note:** ~~`pod 'ios-charts'`~~ is not the correct library, and refers to a different project by someone else.
|
||||
|
||||
## Carthage Install
|
||||
|
||||
Charts now include Carthage prebuilt binaries.
|
||||
|
||||
```carthage
|
||||
github "danielgindi/Charts" == 3.1.1
|
||||
github "danielgindi/Charts" ~> 3.1.1
|
||||
```
|
||||
|
||||
In order to build the binaries for a new release, use `carthage build --no-skip-current && carthage archive Charts`.
|
||||
|
||||
## 3rd party bindings
|
||||
|
||||
Xamarin (by @Flash3001): *iOS* - [GitHub](https://github.com/Flash3001/iOSCharts.Xamarin)/[NuGet](https://www.nuget.org/packages/iOSCharts/). *Android* - [GitHub](https://github.com/Flash3001/MPAndroidChart.Xamarin)/[NuGet](https://www.nuget.org/packages/MPAndroidChart/).
|
||||
|
||||
## Help
|
||||
|
||||
If you like what you see here, and want to support the work being done in this repository, you could:
|
||||
* Contribute code, issues and pull requests
|
||||
* Let people know this library exists (:fire: spread the word :fire:)
|
||||
* [](https://www.paypal.com/cgi-bin/webscr?cmd=_s-xclick&hosted_button_id=68UL6Y8KUPS96) (You can buy me a beer, or you can buy me dinner :-)
|
||||
|
||||
**Note:** The author of [MPAndroidChart](https://github.com/PhilJay/MPAndroidChart) is the reason that this library exists, and is accepting [donations](https://github.com/PhilJay/MPAndroidChart#donations) on his page. He deserves them!
|
||||
|
||||
Questions & Issues
|
||||
-----
|
||||
|
||||
If you are having questions or problems, you should:
|
||||
|
||||
- Make sure you are using the latest version of the library. Check the [**release-section**](https://github.com/danielgindi/Charts/releases).
|
||||
- Study the Android version's [**Documentation-Wiki**](https://github.com/PhilJay/MPAndroidChart/wiki)
|
||||
- Study the (Still incomplete [](http://cocoadocs.org/docsets/Charts/)) [**Pod-Documentation**](http://cocoadocs.org/docsets/Charts/)
|
||||
- Search or open questions on [**stackoverflow**](http://stackoverflow.com/questions/tagged/ios-charts) with the `ios-charts` tag
|
||||
- Search [**known issues**](https://github.com/danielgindi/Charts/issues) for your problem (open and closed)
|
||||
- Create new issues (please :fire: **search known issues before** :fire:, do not create duplicate issues)
|
||||
|
||||
|
||||
Features
|
||||
=======
|
||||
|
||||
**Core features:**
|
||||
- 8 different chart types
|
||||
- Scaling on both axes (with touch-gesture, axes separately or pinch-zoom)
|
||||
- Dragging / Panning (with touch-gesture)
|
||||
- Combined-Charts (line-, bar-, scatter-, candle-stick-, bubble-)
|
||||
- Dual (separate) Axes
|
||||
- Customizable Axes (both x- and y-axis)
|
||||
- Highlighting values (with customizable popup-views)
|
||||
- Save chart to camera-roll / export to PNG/JPEG
|
||||
- Predefined color templates
|
||||
- Legends (generated automatically, customizable)
|
||||
- Animations (build up animations, on both x- and y-axis)
|
||||
- Limit lines (providing additional information, maximums, ...)
|
||||
- Fully customizable (paints, typefaces, legends, colors, background, gestures, dashed lines, ...)
|
||||
- Plotting data directly from [**Realm.io**](https://realm.io) mobile database ([here](https://github.com/danielgindi/ChartsRealm))
|
||||
|
||||
**Chart types:**
|
||||
|
||||
*Screenshots are currently taken from the original repository, as they render exactly the same :-)*
|
||||
|
||||
|
||||
- **LineChart (with legend, simple design)**
|
||||

|
||||
- **LineChart (with legend, simple design)**
|
||||
|
||||
|
||||
- **LineChart (cubic lines)**
|
||||
|
||||
|
||||
- **LineChart (gradient fill)**
|
||||
|
||||
|
||||
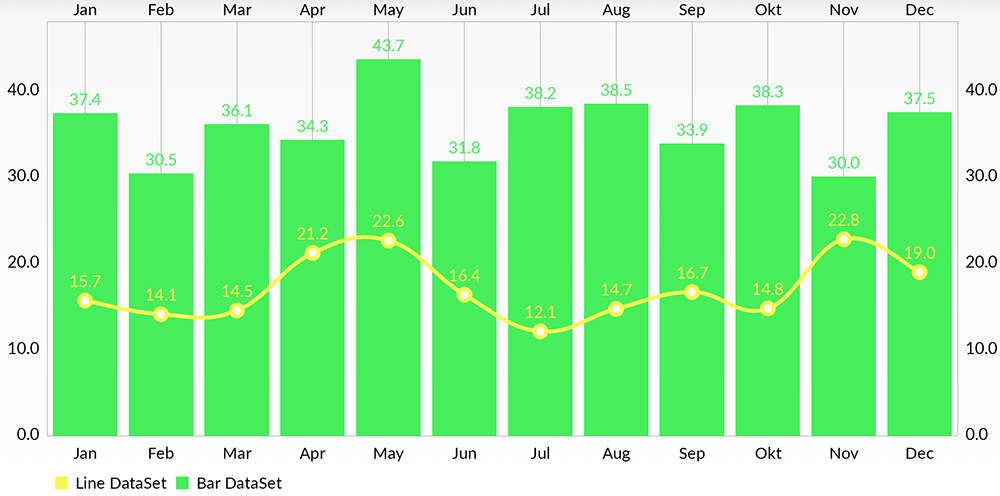
- **Combined-Chart (bar- and linechart in this case)**
|
||||
|
||||
|
||||
- **BarChart (with legend, simple design)**
|
||||
|
||||

|
||||
|
||||
- **BarChart (grouped DataSets)**
|
||||
|
||||

|
||||
|
||||
- **Horizontal-BarChart**
|
||||
|
||||
|
||||
|
||||
|
||||
- **PieChart (with selection, ...)**
|
||||
|
||||

|
||||
|
||||
- **ScatterChart** (with squares, triangles, circles, ... and more)
|
||||
|
||||

|
||||
|
||||
- **CandleStickChart** (for financial data)
|
||||
|
||||

|
||||
|
||||
- **BubbleChart** (area covered by bubbles indicates the value)
|
||||
|
||||

|
||||
|
||||
- **RadarChart** (spider web chart)
|
||||
|
||||

|
||||
|
||||
|
||||
Documentation
|
||||
=======
|
||||
Currently there's no need for documentation for the iOS/tvOS/macOS version, as the API is **95% the same** as on Android.
|
||||
You can read the official [MPAndroidChart](https://github.com/PhilJay/MPAndroidChart) documentation here: [**Wiki**](https://github.com/PhilJay/MPAndroidChart/wiki)
|
||||
|
||||
Or you can see the [**ChartsDemo**](https://github.com/danielgindi/Charts/tree/master/ChartsDemo) project and learn the how-tos from it.
|
||||
|
||||
|
||||
Special Thanks
|
||||
=======
|
||||
|
||||
Goes to [@liuxuan30](https://github.com/liuxuan30), [@petester42](https://github.com/petester42) and [@AlBirdie](https://github.com/AlBirdie) for new features, bugfixes, and lots and lots of involvement in our open-sourced community! You guys are a huge help to all of those coming here with questions and issues, and I couldn't respond to all of those without you.
|
||||
|
||||
License
|
||||
=======
|
||||
Copyright 2016 Daniel Cohen Gindi & Philipp Jahoda
|
||||
|
||||
Licensed under the Apache License, Version 2.0 (the "License");
|
||||
you may not use this file except in compliance with the License.
|
||||
You may obtain a copy of the License at
|
||||
|
||||
http://www.apache.org/licenses/LICENSE-2.0
|
||||
|
||||
Unless required by applicable law or agreed to in writing, software
|
||||
distributed under the License is distributed on an "AS IS" BASIS,
|
||||
WITHOUT WARRANTIES OR CONDITIONS OF ANY KIND, either express or implied.
|
||||
See the License for the specific language governing permissions and
|
||||
limitations under the License.
|
||||
268
Pods/Charts/Source/Charts/Animation/Animator.swift
generated
Normal file
268
Pods/Charts/Source/Charts/Animation/Animator.swift
generated
Normal file
@@ -0,0 +1,268 @@
|
||||
//
|
||||
// Animator.swift
|
||||
// Charts
|
||||
//
|
||||
// Copyright 2015 Daniel Cohen Gindi & Philipp Jahoda
|
||||
// A port of MPAndroidChart for iOS
|
||||
// Licensed under Apache License 2.0
|
||||
//
|
||||
// https://github.com/danielgindi/Charts
|
||||
//
|
||||
|
||||
import Foundation
|
||||
import CoreGraphics
|
||||
|
||||
#if !os(OSX)
|
||||
import UIKit
|
||||
#endif
|
||||
|
||||
@objc(ChartAnimatorDelegate)
|
||||
public protocol AnimatorDelegate
|
||||
{
|
||||
/// Called when the Animator has stepped.
|
||||
func animatorUpdated(_ animator: Animator)
|
||||
|
||||
/// Called when the Animator has stopped.
|
||||
func animatorStopped(_ animator: Animator)
|
||||
}
|
||||
|
||||
@objc(ChartAnimator)
|
||||
open class Animator: NSObject
|
||||
{
|
||||
@objc open weak var delegate: AnimatorDelegate?
|
||||
@objc open var updateBlock: (() -> Void)?
|
||||
@objc open var stopBlock: (() -> Void)?
|
||||
|
||||
/// the phase that is animated and influences the drawn values on the x-axis
|
||||
@objc open var phaseX: Double = 1.0
|
||||
|
||||
/// the phase that is animated and influences the drawn values on the y-axis
|
||||
@objc open var phaseY: Double = 1.0
|
||||
|
||||
private var _startTimeX: TimeInterval = 0.0
|
||||
private var _startTimeY: TimeInterval = 0.0
|
||||
private var _displayLink: NSUIDisplayLink?
|
||||
|
||||
private var _durationX: TimeInterval = 0.0
|
||||
private var _durationY: TimeInterval = 0.0
|
||||
|
||||
private var _endTimeX: TimeInterval = 0.0
|
||||
private var _endTimeY: TimeInterval = 0.0
|
||||
private var _endTime: TimeInterval = 0.0
|
||||
|
||||
private var _enabledX: Bool = false
|
||||
private var _enabledY: Bool = false
|
||||
|
||||
private var _easingX: ChartEasingFunctionBlock?
|
||||
private var _easingY: ChartEasingFunctionBlock?
|
||||
|
||||
public override init()
|
||||
{
|
||||
super.init()
|
||||
}
|
||||
|
||||
deinit
|
||||
{
|
||||
stop()
|
||||
}
|
||||
|
||||
@objc open func stop()
|
||||
{
|
||||
guard _displayLink != nil else { return }
|
||||
|
||||
_displayLink?.remove(from: .main, forMode: .commonModes)
|
||||
_displayLink = nil
|
||||
|
||||
_enabledX = false
|
||||
_enabledY = false
|
||||
|
||||
// If we stopped an animation in the middle, we do not want to leave it like this
|
||||
if phaseX != 1.0 || phaseY != 1.0
|
||||
{
|
||||
phaseX = 1.0
|
||||
phaseY = 1.0
|
||||
|
||||
delegate?.animatorUpdated(self)
|
||||
updateBlock?()
|
||||
}
|
||||
|
||||
delegate?.animatorStopped(self)
|
||||
stopBlock?()
|
||||
}
|
||||
|
||||
private func updateAnimationPhases(_ currentTime: TimeInterval)
|
||||
{
|
||||
if _enabledX
|
||||
{
|
||||
let elapsedTime: TimeInterval = currentTime - _startTimeX
|
||||
let duration: TimeInterval = _durationX
|
||||
var elapsed: TimeInterval = elapsedTime
|
||||
if elapsed > duration
|
||||
{
|
||||
elapsed = duration
|
||||
}
|
||||
|
||||
phaseX = _easingX?(elapsed, duration) ?? elapsed / duration
|
||||
}
|
||||
|
||||
if _enabledY
|
||||
{
|
||||
let elapsedTime: TimeInterval = currentTime - _startTimeY
|
||||
let duration: TimeInterval = _durationY
|
||||
var elapsed: TimeInterval = elapsedTime
|
||||
if elapsed > duration
|
||||
{
|
||||
elapsed = duration
|
||||
}
|
||||
|
||||
phaseY = _easingY?(elapsed, duration) ?? elapsed / duration
|
||||
}
|
||||
}
|
||||
|
||||
@objc private func animationLoop()
|
||||
{
|
||||
let currentTime: TimeInterval = CACurrentMediaTime()
|
||||
|
||||
updateAnimationPhases(currentTime)
|
||||
|
||||
delegate?.animatorUpdated(self)
|
||||
updateBlock?()
|
||||
|
||||
if currentTime >= _endTime
|
||||
{
|
||||
stop()
|
||||
}
|
||||
}
|
||||
|
||||
/// Animates the drawing / rendering of the chart on both x- and y-axis with the specified animation time.
|
||||
/// If `animate(...)` is called, no further calling of `invalidate()` is necessary to refresh the chart.
|
||||
/// - parameter xAxisDuration: duration for animating the x axis
|
||||
/// - parameter yAxisDuration: duration for animating the y axis
|
||||
/// - parameter easingX: an easing function for the animation on the x axis
|
||||
/// - parameter easingY: an easing function for the animation on the y axis
|
||||
@objc open func animate(xAxisDuration: TimeInterval, yAxisDuration: TimeInterval, easingX: ChartEasingFunctionBlock?, easingY: ChartEasingFunctionBlock?)
|
||||
{
|
||||
stop()
|
||||
|
||||
_startTimeX = CACurrentMediaTime()
|
||||
_startTimeY = _startTimeX
|
||||
_durationX = xAxisDuration
|
||||
_durationY = yAxisDuration
|
||||
_endTimeX = _startTimeX + xAxisDuration
|
||||
_endTimeY = _startTimeY + yAxisDuration
|
||||
_endTime = _endTimeX > _endTimeY ? _endTimeX : _endTimeY
|
||||
_enabledX = xAxisDuration > 0.0
|
||||
_enabledY = yAxisDuration > 0.0
|
||||
|
||||
_easingX = easingX
|
||||
_easingY = easingY
|
||||
|
||||
// Take care of the first frame if rendering is already scheduled...
|
||||
updateAnimationPhases(_startTimeX)
|
||||
|
||||
if _enabledX || _enabledY
|
||||
{
|
||||
_displayLink = NSUIDisplayLink(target: self, selector: #selector(animationLoop))
|
||||
_displayLink?.add(to: RunLoop.main, forMode: RunLoopMode.commonModes)
|
||||
}
|
||||
}
|
||||
|
||||
/// Animates the drawing / rendering of the chart on both x- and y-axis with the specified animation time.
|
||||
/// If `animate(...)` is called, no further calling of `invalidate()` is necessary to refresh the chart.
|
||||
/// - parameter xAxisDuration: duration for animating the x axis
|
||||
/// - parameter yAxisDuration: duration for animating the y axis
|
||||
/// - parameter easingOptionX: the easing function for the animation on the x axis
|
||||
/// - parameter easingOptionY: the easing function for the animation on the y axis
|
||||
@objc open func animate(xAxisDuration: TimeInterval, yAxisDuration: TimeInterval, easingOptionX: ChartEasingOption, easingOptionY: ChartEasingOption)
|
||||
{
|
||||
animate(xAxisDuration: xAxisDuration, yAxisDuration: yAxisDuration, easingX: easingFunctionFromOption(easingOptionX), easingY: easingFunctionFromOption(easingOptionY))
|
||||
}
|
||||
|
||||
/// Animates the drawing / rendering of the chart on both x- and y-axis with the specified animation time.
|
||||
/// If `animate(...)` is called, no further calling of `invalidate()` is necessary to refresh the chart.
|
||||
/// - parameter xAxisDuration: duration for animating the x axis
|
||||
/// - parameter yAxisDuration: duration for animating the y axis
|
||||
/// - parameter easing: an easing function for the animation
|
||||
@objc open func animate(xAxisDuration: TimeInterval, yAxisDuration: TimeInterval, easing: ChartEasingFunctionBlock?)
|
||||
{
|
||||
animate(xAxisDuration: xAxisDuration, yAxisDuration: yAxisDuration, easingX: easing, easingY: easing)
|
||||
}
|
||||
|
||||
/// Animates the drawing / rendering of the chart on both x- and y-axis with the specified animation time.
|
||||
/// If `animate(...)` is called, no further calling of `invalidate()` is necessary to refresh the chart.
|
||||
/// - parameter xAxisDuration: duration for animating the x axis
|
||||
/// - parameter yAxisDuration: duration for animating the y axis
|
||||
/// - parameter easingOption: the easing function for the animation
|
||||
@objc open func animate(xAxisDuration: TimeInterval, yAxisDuration: TimeInterval, easingOption: ChartEasingOption = .easeInOutSine)
|
||||
{
|
||||
animate(xAxisDuration: xAxisDuration, yAxisDuration: yAxisDuration, easing: easingFunctionFromOption(easingOption))
|
||||
}
|
||||
|
||||
/// Animates the drawing / rendering of the chart the x-axis with the specified animation time.
|
||||
/// If `animate(...)` is called, no further calling of `invalidate()` is necessary to refresh the chart.
|
||||
/// - parameter xAxisDuration: duration for animating the x axis
|
||||
/// - parameter easing: an easing function for the animation
|
||||
@objc open func animate(xAxisDuration: TimeInterval, easing: ChartEasingFunctionBlock?)
|
||||
{
|
||||
_startTimeX = CACurrentMediaTime()
|
||||
_durationX = xAxisDuration
|
||||
_endTimeX = _startTimeX + xAxisDuration
|
||||
_endTime = _endTimeX > _endTimeY ? _endTimeX : _endTimeY
|
||||
_enabledX = xAxisDuration > 0.0
|
||||
|
||||
_easingX = easing
|
||||
|
||||
// Take care of the first frame if rendering is already scheduled...
|
||||
updateAnimationPhases(_startTimeX)
|
||||
|
||||
if _enabledX || _enabledY,
|
||||
_displayLink == nil
|
||||
{
|
||||
_displayLink = NSUIDisplayLink(target: self, selector: #selector(animationLoop))
|
||||
_displayLink?.add(to: .main, forMode: .commonModes)
|
||||
}
|
||||
}
|
||||
|
||||
/// Animates the drawing / rendering of the chart the x-axis with the specified animation time.
|
||||
/// If `animate(...)` is called, no further calling of `invalidate()` is necessary to refresh the chart.
|
||||
/// - parameter xAxisDuration: duration for animating the x axis
|
||||
/// - parameter easingOption: the easing function for the animation
|
||||
@objc open func animate(xAxisDuration: TimeInterval, easingOption: ChartEasingOption = .easeInOutSine)
|
||||
{
|
||||
animate(xAxisDuration: xAxisDuration, easing: easingFunctionFromOption(easingOption))
|
||||
}
|
||||
|
||||
/// Animates the drawing / rendering of the chart the y-axis with the specified animation time.
|
||||
/// If `animate(...)` is called, no further calling of `invalidate()` is necessary to refresh the chart.
|
||||
/// - parameter yAxisDuration: duration for animating the y axis
|
||||
/// - parameter easing: an easing function for the animation
|
||||
@objc open func animate(yAxisDuration: TimeInterval, easing: ChartEasingFunctionBlock?)
|
||||
{
|
||||
_startTimeY = CACurrentMediaTime()
|
||||
_durationY = yAxisDuration
|
||||
_endTimeY = _startTimeY + yAxisDuration
|
||||
_endTime = _endTimeX > _endTimeY ? _endTimeX : _endTimeY
|
||||
_enabledY = yAxisDuration > 0.0
|
||||
|
||||
_easingY = easing
|
||||
|
||||
// Take care of the first frame if rendering is already scheduled...
|
||||
updateAnimationPhases(_startTimeY)
|
||||
|
||||
if _enabledX || _enabledY,
|
||||
_displayLink == nil
|
||||
{
|
||||
_displayLink = NSUIDisplayLink(target: self, selector: #selector(animationLoop))
|
||||
_displayLink?.add(to: .main, forMode: .commonModes)
|
||||
}
|
||||
}
|
||||
|
||||
/// Animates the drawing / rendering of the chart the y-axis with the specified animation time.
|
||||
/// If `animate(...)` is called, no further calling of `invalidate()` is necessary to refresh the chart.
|
||||
/// - parameter yAxisDuration: duration for animating the y axis
|
||||
/// - parameter easingOption: the easing function for the animation
|
||||
@objc open func animate(yAxisDuration: TimeInterval, easingOption: ChartEasingOption = .easeInOutSine)
|
||||
{
|
||||
animate(yAxisDuration: yAxisDuration, easing: easingFunctionFromOption(easingOption))
|
||||
}
|
||||
}
|
||||
394
Pods/Charts/Source/Charts/Animation/ChartAnimationEasing.swift
generated
Normal file
394
Pods/Charts/Source/Charts/Animation/ChartAnimationEasing.swift
generated
Normal file
@@ -0,0 +1,394 @@
|
||||
//
|
||||
// ChartAnimationUtils.swift
|
||||
// Charts
|
||||
//
|
||||
// Copyright 2015 Daniel Cohen Gindi & Philipp Jahoda
|
||||
// A port of MPAndroidChart for iOS
|
||||
// Licensed under Apache License 2.0
|
||||
//
|
||||
// https://github.com/danielgindi/Charts
|
||||
//
|
||||
|
||||
import Foundation
|
||||
import CoreGraphics
|
||||
|
||||
@objc
|
||||
public enum ChartEasingOption: Int
|
||||
{
|
||||
case linear
|
||||
case easeInQuad
|
||||
case easeOutQuad
|
||||
case easeInOutQuad
|
||||
case easeInCubic
|
||||
case easeOutCubic
|
||||
case easeInOutCubic
|
||||
case easeInQuart
|
||||
case easeOutQuart
|
||||
case easeInOutQuart
|
||||
case easeInQuint
|
||||
case easeOutQuint
|
||||
case easeInOutQuint
|
||||
case easeInSine
|
||||
case easeOutSine
|
||||
case easeInOutSine
|
||||
case easeInExpo
|
||||
case easeOutExpo
|
||||
case easeInOutExpo
|
||||
case easeInCirc
|
||||
case easeOutCirc
|
||||
case easeInOutCirc
|
||||
case easeInElastic
|
||||
case easeOutElastic
|
||||
case easeInOutElastic
|
||||
case easeInBack
|
||||
case easeOutBack
|
||||
case easeInOutBack
|
||||
case easeInBounce
|
||||
case easeOutBounce
|
||||
case easeInOutBounce
|
||||
}
|
||||
|
||||
public typealias ChartEasingFunctionBlock = ((_ elapsed: TimeInterval, _ duration: TimeInterval) -> Double)
|
||||
|
||||
internal func easingFunctionFromOption(_ easing: ChartEasingOption) -> ChartEasingFunctionBlock
|
||||
{
|
||||
switch easing
|
||||
{
|
||||
case .linear:
|
||||
return EasingFunctions.Linear
|
||||
case .easeInQuad:
|
||||
return EasingFunctions.EaseInQuad
|
||||
case .easeOutQuad:
|
||||
return EasingFunctions.EaseOutQuad
|
||||
case .easeInOutQuad:
|
||||
return EasingFunctions.EaseInOutQuad
|
||||
case .easeInCubic:
|
||||
return EasingFunctions.EaseInCubic
|
||||
case .easeOutCubic:
|
||||
return EasingFunctions.EaseOutCubic
|
||||
case .easeInOutCubic:
|
||||
return EasingFunctions.EaseInOutCubic
|
||||
case .easeInQuart:
|
||||
return EasingFunctions.EaseInQuart
|
||||
case .easeOutQuart:
|
||||
return EasingFunctions.EaseOutQuart
|
||||
case .easeInOutQuart:
|
||||
return EasingFunctions.EaseInOutQuart
|
||||
case .easeInQuint:
|
||||
return EasingFunctions.EaseInQuint
|
||||
case .easeOutQuint:
|
||||
return EasingFunctions.EaseOutQuint
|
||||
case .easeInOutQuint:
|
||||
return EasingFunctions.EaseInOutQuint
|
||||
case .easeInSine:
|
||||
return EasingFunctions.EaseInSine
|
||||
case .easeOutSine:
|
||||
return EasingFunctions.EaseOutSine
|
||||
case .easeInOutSine:
|
||||
return EasingFunctions.EaseInOutSine
|
||||
case .easeInExpo:
|
||||
return EasingFunctions.EaseInExpo
|
||||
case .easeOutExpo:
|
||||
return EasingFunctions.EaseOutExpo
|
||||
case .easeInOutExpo:
|
||||
return EasingFunctions.EaseInOutExpo
|
||||
case .easeInCirc:
|
||||
return EasingFunctions.EaseInCirc
|
||||
case .easeOutCirc:
|
||||
return EasingFunctions.EaseOutCirc
|
||||
case .easeInOutCirc:
|
||||
return EasingFunctions.EaseInOutCirc
|
||||
case .easeInElastic:
|
||||
return EasingFunctions.EaseInElastic
|
||||
case .easeOutElastic:
|
||||
return EasingFunctions.EaseOutElastic
|
||||
case .easeInOutElastic:
|
||||
return EasingFunctions.EaseInOutElastic
|
||||
case .easeInBack:
|
||||
return EasingFunctions.EaseInBack
|
||||
case .easeOutBack:
|
||||
return EasingFunctions.EaseOutBack
|
||||
case .easeInOutBack:
|
||||
return EasingFunctions.EaseInOutBack
|
||||
case .easeInBounce:
|
||||
return EasingFunctions.EaseInBounce
|
||||
case .easeOutBounce:
|
||||
return EasingFunctions.EaseOutBounce
|
||||
case .easeInOutBounce:
|
||||
return EasingFunctions.EaseInOutBounce
|
||||
}
|
||||
}
|
||||
|
||||
internal struct EasingFunctions
|
||||
{
|
||||
internal static let Linear = { (elapsed: TimeInterval, duration: TimeInterval) -> Double in return Double(elapsed / duration) }
|
||||
|
||||
internal static let EaseInQuad = { (elapsed: TimeInterval, duration: TimeInterval) -> Double in
|
||||
var position = Double(elapsed / duration)
|
||||
return position * position
|
||||
}
|
||||
|
||||
internal static let EaseOutQuad = { (elapsed: TimeInterval, duration: TimeInterval) -> Double in
|
||||
var position = Double(elapsed / duration)
|
||||
return -position * (position - 2.0)
|
||||
}
|
||||
|
||||
internal static let EaseInOutQuad = { (elapsed: TimeInterval, duration: TimeInterval) -> Double in
|
||||
var position = Double(elapsed / (duration / 2.0))
|
||||
if position < 1.0
|
||||
{
|
||||
return 0.5 * position * position
|
||||
}
|
||||
|
||||
return -0.5 * ((position - 1.0) * (position - 3.0) - 1.0)
|
||||
}
|
||||
|
||||
internal static let EaseInCubic = { (elapsed: TimeInterval, duration: TimeInterval) -> Double in
|
||||
var position = Double(elapsed / duration)
|
||||
return position * position * position
|
||||
}
|
||||
|
||||
internal static let EaseOutCubic = { (elapsed: TimeInterval, duration: TimeInterval) -> Double in
|
||||
var position = Double(elapsed / duration)
|
||||
position -= 1.0
|
||||
return (position * position * position + 1.0)
|
||||
}
|
||||
|
||||
internal static let EaseInOutCubic = { (elapsed: TimeInterval, duration: TimeInterval) -> Double in
|
||||
var position = Double(elapsed / (duration / 2.0))
|
||||
if position < 1.0
|
||||
{
|
||||
return 0.5 * position * position * position
|
||||
}
|
||||
position -= 2.0
|
||||
return 0.5 * (position * position * position + 2.0)
|
||||
}
|
||||
|
||||
internal static let EaseInQuart = { (elapsed: TimeInterval, duration: TimeInterval) -> Double in
|
||||
var position = Double(elapsed / duration)
|
||||
return position * position * position * position
|
||||
}
|
||||
|
||||
internal static let EaseOutQuart = { (elapsed: TimeInterval, duration: TimeInterval) -> Double in
|
||||
var position = Double(elapsed / duration)
|
||||
position -= 1.0
|
||||
return -(position * position * position * position - 1.0)
|
||||
}
|
||||
|
||||
internal static let EaseInOutQuart = { (elapsed: TimeInterval, duration: TimeInterval) -> Double in
|
||||
var position = Double(elapsed / (duration / 2.0))
|
||||
if position < 1.0
|
||||
{
|
||||
return 0.5 * position * position * position * position
|
||||
}
|
||||
position -= 2.0
|
||||
return -0.5 * (position * position * position * position - 2.0)
|
||||
}
|
||||
|
||||
internal static let EaseInQuint = { (elapsed: TimeInterval, duration: TimeInterval) -> Double in
|
||||
var position = Double(elapsed / duration)
|
||||
return position * position * position * position * position
|
||||
}
|
||||
|
||||
internal static let EaseOutQuint = { (elapsed: TimeInterval, duration: TimeInterval) -> Double in
|
||||
var position = Double(elapsed / duration)
|
||||
position -= 1.0
|
||||
return (position * position * position * position * position + 1.0)
|
||||
}
|
||||
|
||||
internal static let EaseInOutQuint = { (elapsed: TimeInterval, duration: TimeInterval) -> Double in
|
||||
var position = Double(elapsed / (duration / 2.0))
|
||||
if position < 1.0
|
||||
{
|
||||
return 0.5 * position * position * position * position * position
|
||||
}
|
||||
else
|
||||
{
|
||||
position -= 2.0
|
||||
return 0.5 * (position * position * position * position * position + 2.0)
|
||||
}
|
||||
}
|
||||
|
||||
internal static let EaseInSine = { (elapsed: TimeInterval, duration: TimeInterval) -> Double in
|
||||
var position: TimeInterval = elapsed / duration
|
||||
return Double( -cos(position * Double.pi / 2) + 1.0 )
|
||||
}
|
||||
|
||||
internal static let EaseOutSine = { (elapsed: TimeInterval, duration: TimeInterval) -> Double in
|
||||
var position: TimeInterval = elapsed / duration
|
||||
return Double( sin(position * Double.pi / 2) )
|
||||
}
|
||||
|
||||
internal static let EaseInOutSine = { (elapsed: TimeInterval, duration: TimeInterval) -> Double in
|
||||
var position: TimeInterval = elapsed / duration
|
||||
return Double( -0.5 * (cos(Double.pi * position) - 1.0) )
|
||||
}
|
||||
|
||||
internal static let EaseInExpo = { (elapsed: TimeInterval, duration: TimeInterval) -> Double in
|
||||
return (elapsed == 0) ? 0.0 : Double(pow(2.0, 10.0 * (elapsed / duration - 1.0)))
|
||||
}
|
||||
|
||||
internal static let EaseOutExpo = { (elapsed: TimeInterval, duration: TimeInterval) -> Double in
|
||||
return (elapsed == duration) ? 1.0 : (-Double(pow(2.0, -10.0 * elapsed / duration)) + 1.0)
|
||||
}
|
||||
|
||||
internal static let EaseInOutExpo = { (elapsed: TimeInterval, duration: TimeInterval) -> Double in
|
||||
if elapsed == 0
|
||||
{
|
||||
return 0.0
|
||||
}
|
||||
if elapsed == duration
|
||||
{
|
||||
return 1.0
|
||||
}
|
||||
|
||||
var position: TimeInterval = elapsed / (duration / 2.0)
|
||||
if position < 1.0
|
||||
{
|
||||
return Double( 0.5 * pow(2.0, 10.0 * (position - 1.0)) )
|
||||
}
|
||||
|
||||
position = position - 1.0
|
||||
return Double( 0.5 * (-pow(2.0, -10.0 * position) + 2.0) )
|
||||
}
|
||||
|
||||
internal static let EaseInCirc = { (elapsed: TimeInterval, duration: TimeInterval) -> Double in
|
||||
var position = Double(elapsed / duration)
|
||||
return -(Double(sqrt(1.0 - position * position)) - 1.0)
|
||||
}
|
||||
|
||||
internal static let EaseOutCirc = { (elapsed: TimeInterval, duration: TimeInterval) -> Double in
|
||||
var position = Double(elapsed / duration)
|
||||
position -= 1.0
|
||||
return Double( sqrt(1 - position * position) )
|
||||
}
|
||||
|
||||
internal static let EaseInOutCirc = { (elapsed: TimeInterval, duration: TimeInterval) -> Double in
|
||||
var position: TimeInterval = elapsed / (duration / 2.0)
|
||||
if position < 1.0
|
||||
{
|
||||
return Double( -0.5 * (sqrt(1.0 - position * position) - 1.0) )
|
||||
}
|
||||
position -= 2.0
|
||||
return Double( 0.5 * (sqrt(1.0 - position * position) + 1.0) )
|
||||
}
|
||||
|
||||
internal static let EaseInElastic = { (elapsed: TimeInterval, duration: TimeInterval) -> Double in
|
||||
if elapsed == 0.0
|
||||
{
|
||||
return 0.0
|
||||
}
|
||||
|
||||
var position: TimeInterval = elapsed / duration
|
||||
if position == 1.0
|
||||
{
|
||||
return 1.0
|
||||
}
|
||||
|
||||
var p = duration * 0.3
|
||||
var s = p / (2.0 * Double.pi) * asin(1.0)
|
||||
position -= 1.0
|
||||
return Double( -(pow(2.0, 10.0 * position) * sin((position * duration - s) * (2.0 * Double.pi) / p)) )
|
||||
}
|
||||
|
||||
internal static let EaseOutElastic = { (elapsed: TimeInterval, duration: TimeInterval) -> Double in
|
||||
if elapsed == 0.0
|
||||
{
|
||||
return 0.0
|
||||
}
|
||||
|
||||
var position: TimeInterval = elapsed / duration
|
||||
if position == 1.0
|
||||
{
|
||||
return 1.0
|
||||
}
|
||||
|
||||
var p = duration * 0.3
|
||||
var s = p / (2.0 * Double.pi) * asin(1.0)
|
||||
return Double( pow(2.0, -10.0 * position) * sin((position * duration - s) * (2.0 * Double.pi) / p) + 1.0 )
|
||||
}
|
||||
|
||||
internal static let EaseInOutElastic = { (elapsed: TimeInterval, duration: TimeInterval) -> Double in
|
||||
if elapsed == 0.0
|
||||
{
|
||||
return 0.0
|
||||
}
|
||||
|
||||
var position: TimeInterval = elapsed / (duration / 2.0)
|
||||
if position == 2.0
|
||||
{
|
||||
return 1.0
|
||||
}
|
||||
|
||||
var p = duration * (0.3 * 1.5)
|
||||
var s = p / (2.0 * Double.pi) * asin(1.0)
|
||||
if position < 1.0
|
||||
{
|
||||
position -= 1.0
|
||||
return Double( -0.5 * (pow(2.0, 10.0 * position) * sin((position * duration - s) * (2.0 * Double.pi) / p)) )
|
||||
}
|
||||
position -= 1.0
|
||||
return Double( pow(2.0, -10.0 * position) * sin((position * duration - s) * (2.0 * Double.pi) / p) * 0.5 + 1.0 )
|
||||
}
|
||||
|
||||
internal static let EaseInBack = { (elapsed: TimeInterval, duration: TimeInterval) -> Double in
|
||||
let s: TimeInterval = 1.70158
|
||||
var position: TimeInterval = elapsed / duration
|
||||
return Double( position * position * ((s + 1.0) * position - s) )
|
||||
}
|
||||
|
||||
internal static let EaseOutBack = { (elapsed: TimeInterval, duration: TimeInterval) -> Double in
|
||||
let s: TimeInterval = 1.70158
|
||||
var position: TimeInterval = elapsed / duration
|
||||
position -= 1.0
|
||||
return Double( position * position * ((s + 1.0) * position + s) + 1.0 )
|
||||
}
|
||||
|
||||
internal static let EaseInOutBack = { (elapsed: TimeInterval, duration: TimeInterval) -> Double in
|
||||
var s: TimeInterval = 1.70158
|
||||
var position: TimeInterval = elapsed / (duration / 2.0)
|
||||
if position < 1.0
|
||||
{
|
||||
s *= 1.525
|
||||
return Double( 0.5 * (position * position * ((s + 1.0) * position - s)) )
|
||||
}
|
||||
s *= 1.525
|
||||
position -= 2.0
|
||||
return Double( 0.5 * (position * position * ((s + 1.0) * position + s) + 2.0) )
|
||||
}
|
||||
|
||||
internal static let EaseInBounce = { (elapsed: TimeInterval, duration: TimeInterval) -> Double in
|
||||
return 1.0 - EaseOutBounce(duration - elapsed, duration)
|
||||
}
|
||||
|
||||
internal static let EaseOutBounce = { (elapsed: TimeInterval, duration: TimeInterval) -> Double in
|
||||
var position: TimeInterval = elapsed / duration
|
||||
if position < (1.0 / 2.75)
|
||||
{
|
||||
return Double( 7.5625 * position * position )
|
||||
}
|
||||
else if position < (2.0 / 2.75)
|
||||
{
|
||||
position -= (1.5 / 2.75)
|
||||
return Double( 7.5625 * position * position + 0.75 )
|
||||
}
|
||||
else if position < (2.5 / 2.75)
|
||||
{
|
||||
position -= (2.25 / 2.75)
|
||||
return Double( 7.5625 * position * position + 0.9375 )
|
||||
}
|
||||
else
|
||||
{
|
||||
position -= (2.625 / 2.75)
|
||||
return Double( 7.5625 * position * position + 0.984375 )
|
||||
}
|
||||
}
|
||||
|
||||
internal static let EaseInOutBounce = { (elapsed: TimeInterval, duration: TimeInterval) -> Double in
|
||||
if elapsed < (duration / 2.0)
|
||||
{
|
||||
return EaseInBounce(elapsed * 2.0, duration) * 0.5
|
||||
}
|
||||
return EaseOutBounce(elapsed * 2.0 - duration, duration) * 0.5 + 0.5
|
||||
}
|
||||
}
|
||||
183
Pods/Charts/Source/Charts/Charts/BarChartView.swift
generated
Normal file
183
Pods/Charts/Source/Charts/Charts/BarChartView.swift
generated
Normal file
@@ -0,0 +1,183 @@
|
||||
//
|
||||
// BarChartView.swift
|
||||
// Charts
|
||||
//
|
||||
// Copyright 2015 Daniel Cohen Gindi & Philipp Jahoda
|
||||
// A port of MPAndroidChart for iOS
|
||||
// Licensed under Apache License 2.0
|
||||
//
|
||||
// https://github.com/danielgindi/Charts
|
||||
//
|
||||
|
||||
import Foundation
|
||||
import CoreGraphics
|
||||
|
||||
/// Chart that draws bars.
|
||||
open class BarChartView: BarLineChartViewBase, BarChartDataProvider
|
||||
{
|
||||
/// if set to true, all values are drawn above their bars, instead of below their top
|
||||
private var _drawValueAboveBarEnabled = true
|
||||
|
||||
/// if set to true, a grey area is drawn behind each bar that indicates the maximum value
|
||||
private var _drawBarShadowEnabled = false
|
||||
|
||||
internal override func initialize()
|
||||
{
|
||||
super.initialize()
|
||||
|
||||
renderer = BarChartRenderer(dataProvider: self, animator: _animator, viewPortHandler: _viewPortHandler)
|
||||
|
||||
self.highlighter = BarHighlighter(chart: self)
|
||||
|
||||
self.xAxis.spaceMin = 0.5
|
||||
self.xAxis.spaceMax = 0.5
|
||||
}
|
||||
|
||||
internal override func calcMinMax()
|
||||
{
|
||||
guard let data = self.data as? BarChartData
|
||||
else { return }
|
||||
|
||||
if fitBars
|
||||
{
|
||||
_xAxis.calculate(
|
||||
min: data.xMin - data.barWidth / 2.0,
|
||||
max: data.xMax + data.barWidth / 2.0)
|
||||
}
|
||||
else
|
||||
{
|
||||
_xAxis.calculate(min: data.xMin, max: data.xMax)
|
||||
}
|
||||
|
||||
// calculate axis range (min / max) according to provided data
|
||||
leftAxis.calculate(
|
||||
min: data.getYMin(axis: .left),
|
||||
max: data.getYMax(axis: .left))
|
||||
rightAxis.calculate(
|
||||
min: data.getYMin(axis: .right),
|
||||
max: data.getYMax(axis: .right))
|
||||
}
|
||||
|
||||
/// - returns: The Highlight object (contains x-index and DataSet index) of the selected value at the given touch point inside the BarChart.
|
||||
open override func getHighlightByTouchPoint(_ pt: CGPoint) -> Highlight?
|
||||
{
|
||||
if _data === nil
|
||||
{
|
||||
Swift.print("Can't select by touch. No data set.")
|
||||
return nil
|
||||
}
|
||||
|
||||
guard let h = self.highlighter?.getHighlight(x: pt.x, y: pt.y)
|
||||
else { return nil }
|
||||
|
||||
if !isHighlightFullBarEnabled { return h }
|
||||
|
||||
// For isHighlightFullBarEnabled, remove stackIndex
|
||||
return Highlight(
|
||||
x: h.x, y: h.y,
|
||||
xPx: h.xPx, yPx: h.yPx,
|
||||
dataIndex: h.dataIndex,
|
||||
dataSetIndex: h.dataSetIndex,
|
||||
stackIndex: -1,
|
||||
axis: h.axis)
|
||||
}
|
||||
|
||||
/// - returns: The bounding box of the specified Entry in the specified DataSet. Returns null if the Entry could not be found in the charts data.
|
||||
@objc open func getBarBounds(entry e: BarChartDataEntry) -> CGRect
|
||||
{
|
||||
guard let
|
||||
data = _data as? BarChartData,
|
||||
let set = data.getDataSetForEntry(e) as? IBarChartDataSet
|
||||
else { return CGRect.null }
|
||||
|
||||
let y = e.y
|
||||
let x = e.x
|
||||
|
||||
let barWidth = data.barWidth
|
||||
|
||||
let left = x - barWidth / 2.0
|
||||
let right = x + barWidth / 2.0
|
||||
let top = y >= 0.0 ? y : 0.0
|
||||
let bottom = y <= 0.0 ? y : 0.0
|
||||
|
||||
var bounds = CGRect(x: left, y: top, width: right - left, height: bottom - top)
|
||||
|
||||
getTransformer(forAxis: set.axisDependency).rectValueToPixel(&bounds)
|
||||
|
||||
return bounds
|
||||
}
|
||||
|
||||
/// Groups all BarDataSet objects this data object holds together by modifying the x-value of their entries.
|
||||
/// Previously set x-values of entries will be overwritten. Leaves space between bars and groups as specified by the parameters.
|
||||
/// Calls `notifyDataSetChanged()` afterwards.
|
||||
///
|
||||
/// - parameter fromX: the starting point on the x-axis where the grouping should begin
|
||||
/// - parameter groupSpace: the space between groups of bars in values (not pixels) e.g. 0.8f for bar width 1f
|
||||
/// - parameter barSpace: the space between individual bars in values (not pixels) e.g. 0.1f for bar width 1f
|
||||
@objc open func groupBars(fromX: Double, groupSpace: Double, barSpace: Double)
|
||||
{
|
||||
guard let barData = self.barData
|
||||
else
|
||||
{
|
||||
Swift.print("You need to set data for the chart before grouping bars.", terminator: "\n")
|
||||
return
|
||||
}
|
||||
|
||||
barData.groupBars(fromX: fromX, groupSpace: groupSpace, barSpace: barSpace)
|
||||
notifyDataSetChanged()
|
||||
}
|
||||
|
||||
/// Highlights the value at the given x-value in the given DataSet. Provide -1 as the dataSetIndex to undo all highlighting.
|
||||
/// - parameter x:
|
||||
/// - parameter dataSetIndex:
|
||||
/// - parameter stackIndex: the index inside the stack - only relevant for stacked entries
|
||||
@objc open func highlightValue(x: Double, dataSetIndex: Int, stackIndex: Int)
|
||||
{
|
||||
highlightValue(Highlight(x: x, dataSetIndex: dataSetIndex, stackIndex: stackIndex))
|
||||
}
|
||||
|
||||
// MARK: Accessors
|
||||
|
||||
/// if set to true, all values are drawn above their bars, instead of below their top
|
||||
@objc open var drawValueAboveBarEnabled: Bool
|
||||
{
|
||||
get { return _drawValueAboveBarEnabled }
|
||||
set
|
||||
{
|
||||
_drawValueAboveBarEnabled = newValue
|
||||
setNeedsDisplay()
|
||||
}
|
||||
}
|
||||
|
||||
/// if set to true, a grey area is drawn behind each bar that indicates the maximum value
|
||||
@objc open var drawBarShadowEnabled: Bool
|
||||
{
|
||||
get { return _drawBarShadowEnabled }
|
||||
set
|
||||
{
|
||||
_drawBarShadowEnabled = newValue
|
||||
setNeedsDisplay()
|
||||
}
|
||||
}
|
||||
|
||||
/// Adds half of the bar width to each side of the x-axis range in order to allow the bars of the barchart to be fully displayed.
|
||||
/// **default**: false
|
||||
@objc open var fitBars = false
|
||||
|
||||
/// Set this to `true` to make the highlight operation full-bar oriented, `false` to make it highlight single values (relevant only for stacked).
|
||||
/// If enabled, highlighting operations will highlight the whole bar, even if only a single stack entry was tapped.
|
||||
@objc open var highlightFullBarEnabled: Bool = false
|
||||
|
||||
/// - returns: `true` the highlight is be full-bar oriented, `false` ifsingle-value
|
||||
open var isHighlightFullBarEnabled: Bool { return highlightFullBarEnabled }
|
||||
|
||||
// MARK: - BarChartDataProvider
|
||||
|
||||
open var barData: BarChartData? { return _data as? BarChartData }
|
||||
|
||||
/// - returns: `true` if drawing values above bars is enabled, `false` ifnot
|
||||
open var isDrawValueAboveBarEnabled: Bool { return drawValueAboveBarEnabled }
|
||||
|
||||
/// - returns: `true` if drawing shadows (maxvalue) for each bar is enabled, `false` ifnot
|
||||
open var isDrawBarShadowEnabled: Bool { return drawBarShadowEnabled }
|
||||
}
|
||||
1936
Pods/Charts/Source/Charts/Charts/BarLineChartViewBase.swift
generated
Normal file
1936
Pods/Charts/Source/Charts/Charts/BarLineChartViewBase.swift
generated
Normal file
File diff suppressed because it is too large
Load Diff
27
Pods/Charts/Source/Charts/Charts/BubbleChartView.swift
generated
Normal file
27
Pods/Charts/Source/Charts/Charts/BubbleChartView.swift
generated
Normal file
@@ -0,0 +1,27 @@
|
||||
//
|
||||
// BubbleChartView.swift
|
||||
// Charts
|
||||
//
|
||||
// Bubble chart implementation:
|
||||
// Copyright 2015 Pierre-Marc Airoldi
|
||||
// Licensed under Apache License 2.0
|
||||
//
|
||||
// https://github.com/danielgindi/Charts
|
||||
//
|
||||
|
||||
import Foundation
|
||||
import CoreGraphics
|
||||
|
||||
open class BubbleChartView: BarLineChartViewBase, BubbleChartDataProvider
|
||||
{
|
||||
open override func initialize()
|
||||
{
|
||||
super.initialize()
|
||||
|
||||
renderer = BubbleChartRenderer(dataProvider: self, animator: _animator, viewPortHandler: _viewPortHandler)
|
||||
}
|
||||
|
||||
// MARK: - BubbleChartDataProvider
|
||||
|
||||
open var bubbleData: BubbleChartData? { return _data as? BubbleChartData }
|
||||
}
|
||||
34
Pods/Charts/Source/Charts/Charts/CandleStickChartView.swift
generated
Normal file
34
Pods/Charts/Source/Charts/Charts/CandleStickChartView.swift
generated
Normal file
@@ -0,0 +1,34 @@
|
||||
//
|
||||
// CandleStickChartView.swift
|
||||
// Charts
|
||||
//
|
||||
// Copyright 2015 Daniel Cohen Gindi & Philipp Jahoda
|
||||
// A port of MPAndroidChart for iOS
|
||||
// Licensed under Apache License 2.0
|
||||
//
|
||||
// https://github.com/danielgindi/Charts
|
||||
//
|
||||
|
||||
import Foundation
|
||||
import CoreGraphics
|
||||
|
||||
/// Financial chart type that draws candle-sticks.
|
||||
open class CandleStickChartView: BarLineChartViewBase, CandleChartDataProvider
|
||||
{
|
||||
internal override func initialize()
|
||||
{
|
||||
super.initialize()
|
||||
|
||||
renderer = CandleStickChartRenderer(dataProvider: self, animator: _animator, viewPortHandler: _viewPortHandler)
|
||||
|
||||
self.xAxis.spaceMin = 0.5
|
||||
self.xAxis.spaceMax = 0.5
|
||||
}
|
||||
|
||||
// MARK: - CandleChartDataProvider
|
||||
|
||||
open var candleData: CandleChartData?
|
||||
{
|
||||
return _data as? CandleChartData
|
||||
}
|
||||
}
|
||||
992
Pods/Charts/Source/Charts/Charts/ChartViewBase.swift
generated
Normal file
992
Pods/Charts/Source/Charts/Charts/ChartViewBase.swift
generated
Normal file
@@ -0,0 +1,992 @@
|
||||
//
|
||||
// ChartViewBase.swift
|
||||
// Charts
|
||||
//
|
||||
// Copyright 2015 Daniel Cohen Gindi & Philipp Jahoda
|
||||
// A port of MPAndroidChart for iOS
|
||||
// Licensed under Apache License 2.0
|
||||
//
|
||||
// https://github.com/danielgindi/Charts
|
||||
//
|
||||
// Based on https://github.com/PhilJay/MPAndroidChart/commit/c42b880
|
||||
|
||||
import Foundation
|
||||
import CoreGraphics
|
||||
|
||||
#if !os(OSX)
|
||||
import UIKit
|
||||
#endif
|
||||
|
||||
@objc
|
||||
public protocol ChartViewDelegate
|
||||
{
|
||||
/// Called when a value has been selected inside the chart.
|
||||
/// - parameter entry: The selected Entry.
|
||||
/// - parameter highlight: The corresponding highlight object that contains information about the highlighted position such as dataSetIndex etc.
|
||||
@objc optional func chartValueSelected(_ chartView: ChartViewBase, entry: ChartDataEntry, highlight: Highlight)
|
||||
|
||||
// Called when nothing has been selected or an "un-select" has been made.
|
||||
@objc optional func chartValueNothingSelected(_ chartView: ChartViewBase)
|
||||
|
||||
// Callbacks when the chart is scaled / zoomed via pinch zoom gesture.
|
||||
@objc optional func chartScaled(_ chartView: ChartViewBase, scaleX: CGFloat, scaleY: CGFloat)
|
||||
|
||||
// Callbacks when the chart is moved / translated via drag gesture.
|
||||
@objc optional func chartTranslated(_ chartView: ChartViewBase, dX: CGFloat, dY: CGFloat)
|
||||
}
|
||||
|
||||
open class ChartViewBase: NSUIView, ChartDataProvider, AnimatorDelegate
|
||||
{
|
||||
// MARK: - Properties
|
||||
|
||||
/// - returns: The object representing all x-labels, this method can be used to
|
||||
/// acquire the XAxis object and modify it (e.g. change the position of the
|
||||
/// labels)
|
||||
@objc open var xAxis: XAxis
|
||||
{
|
||||
return _xAxis
|
||||
}
|
||||
|
||||
/// The default IValueFormatter that has been determined by the chart considering the provided minimum and maximum values.
|
||||
internal var _defaultValueFormatter: IValueFormatter? = DefaultValueFormatter(decimals: 0)
|
||||
|
||||
/// object that holds all data that was originally set for the chart, before it was modified or any filtering algorithms had been applied
|
||||
internal var _data: ChartData?
|
||||
|
||||
/// Flag that indicates if highlighting per tap (touch) is enabled
|
||||
private var _highlightPerTapEnabled = true
|
||||
|
||||
/// If set to true, chart continues to scroll after touch up
|
||||
@objc open var dragDecelerationEnabled = true
|
||||
|
||||
/// Deceleration friction coefficient in [0 ; 1] interval, higher values indicate that speed will decrease slowly, for example if it set to 0, it will stop immediately.
|
||||
/// 1 is an invalid value, and will be converted to 0.999 automatically.
|
||||
private var _dragDecelerationFrictionCoef: CGFloat = 0.9
|
||||
|
||||
/// if true, units are drawn next to the values in the chart
|
||||
internal var _drawUnitInChart = false
|
||||
|
||||
/// The object representing the labels on the x-axis
|
||||
internal var _xAxis: XAxis!
|
||||
|
||||
/// The `Description` object of the chart.
|
||||
/// This should have been called just "description", but
|
||||
@objc open var chartDescription: Description?
|
||||
|
||||
/// The legend object containing all data associated with the legend
|
||||
internal var _legend: Legend!
|
||||
|
||||
/// delegate to receive chart events
|
||||
@objc open weak var delegate: ChartViewDelegate?
|
||||
|
||||
/// text that is displayed when the chart is empty
|
||||
@objc open var noDataText = "No chart data available."
|
||||
|
||||
/// Font to be used for the no data text.
|
||||
@objc open var noDataFont: NSUIFont! = NSUIFont(name: "HelveticaNeue", size: 12.0)
|
||||
|
||||
/// color of the no data text
|
||||
@objc open var noDataTextColor: NSUIColor = NSUIColor.black
|
||||
|
||||
/// alignment of the no data text
|
||||
open var noDataTextAlignment: NSTextAlignment = .left
|
||||
|
||||
internal var _legendRenderer: LegendRenderer!
|
||||
|
||||
/// object responsible for rendering the data
|
||||
@objc open var renderer: DataRenderer?
|
||||
|
||||
@objc open var highlighter: IHighlighter?
|
||||
|
||||
/// object that manages the bounds and drawing constraints of the chart
|
||||
internal var _viewPortHandler: ViewPortHandler!
|
||||
|
||||
/// object responsible for animations
|
||||
internal var _animator: Animator!
|
||||
|
||||
/// flag that indicates if offsets calculation has already been done or not
|
||||
private var _offsetsCalculated = false
|
||||
|
||||
/// array of Highlight objects that reference the highlighted slices in the chart
|
||||
internal var _indicesToHighlight = [Highlight]()
|
||||
|
||||
/// `true` if drawing the marker is enabled when tapping on values
|
||||
/// (use the `marker` property to specify a marker)
|
||||
@objc open var drawMarkers = true
|
||||
|
||||
/// - returns: `true` if drawing the marker is enabled when tapping on values
|
||||
/// (use the `marker` property to specify a marker)
|
||||
@objc open var isDrawMarkersEnabled: Bool { return drawMarkers }
|
||||
|
||||
/// The marker that is displayed when a value is clicked on the chart
|
||||
@objc open var marker: IMarker?
|
||||
|
||||
private var _interceptTouchEvents = false
|
||||
|
||||
/// An extra offset to be appended to the viewport's top
|
||||
@objc open var extraTopOffset: CGFloat = 0.0
|
||||
|
||||
/// An extra offset to be appended to the viewport's right
|
||||
@objc open var extraRightOffset: CGFloat = 0.0
|
||||
|
||||
/// An extra offset to be appended to the viewport's bottom
|
||||
@objc open var extraBottomOffset: CGFloat = 0.0
|
||||
|
||||
/// An extra offset to be appended to the viewport's left
|
||||
@objc open var extraLeftOffset: CGFloat = 0.0
|
||||
|
||||
@objc open func setExtraOffsets(left: CGFloat, top: CGFloat, right: CGFloat, bottom: CGFloat)
|
||||
{
|
||||
extraLeftOffset = left
|
||||
extraTopOffset = top
|
||||
extraRightOffset = right
|
||||
extraBottomOffset = bottom
|
||||
}
|
||||
|
||||
// MARK: - Initializers
|
||||
|
||||
public override init(frame: CGRect)
|
||||
{
|
||||
super.init(frame: frame)
|
||||
initialize()
|
||||
}
|
||||
|
||||
public required init?(coder aDecoder: NSCoder)
|
||||
{
|
||||
super.init(coder: aDecoder)
|
||||
initialize()
|
||||
}
|
||||
|
||||
deinit
|
||||
{
|
||||
self.removeObserver(self, forKeyPath: "bounds")
|
||||
self.removeObserver(self, forKeyPath: "frame")
|
||||
}
|
||||
|
||||
internal func initialize()
|
||||
{
|
||||
#if os(iOS)
|
||||
self.backgroundColor = NSUIColor.clear
|
||||
#endif
|
||||
|
||||
_animator = Animator()
|
||||
_animator.delegate = self
|
||||
|
||||
_viewPortHandler = ViewPortHandler(width: bounds.size.width, height: bounds.size.height)
|
||||
|
||||
chartDescription = Description()
|
||||
|
||||
_legend = Legend()
|
||||
_legendRenderer = LegendRenderer(viewPortHandler: _viewPortHandler, legend: _legend)
|
||||
|
||||
_xAxis = XAxis()
|
||||
|
||||
self.addObserver(self, forKeyPath: "bounds", options: .new, context: nil)
|
||||
self.addObserver(self, forKeyPath: "frame", options: .new, context: nil)
|
||||
}
|
||||
|
||||
// MARK: - ChartViewBase
|
||||
|
||||
/// The data for the chart
|
||||
open var data: ChartData?
|
||||
{
|
||||
get
|
||||
{
|
||||
return _data
|
||||
}
|
||||
set
|
||||
{
|
||||
_data = newValue
|
||||
_offsetsCalculated = false
|
||||
|
||||
guard let _data = _data else
|
||||
{
|
||||
setNeedsDisplay()
|
||||
return
|
||||
}
|
||||
|
||||
// calculate how many digits are needed
|
||||
setupDefaultFormatter(min: _data.getYMin(), max: _data.getYMax())
|
||||
|
||||
for set in _data.dataSets
|
||||
{
|
||||
if set.needsFormatter || set.valueFormatter === _defaultValueFormatter
|
||||
{
|
||||
set.valueFormatter = _defaultValueFormatter
|
||||
}
|
||||
}
|
||||
|
||||
// let the chart know there is new data
|
||||
notifyDataSetChanged()
|
||||
}
|
||||
}
|
||||
|
||||
/// Clears the chart from all data (sets it to null) and refreshes it (by calling setNeedsDisplay()).
|
||||
@objc open func clear()
|
||||
{
|
||||
_data = nil
|
||||
_offsetsCalculated = false
|
||||
_indicesToHighlight.removeAll()
|
||||
lastHighlighted = nil
|
||||
|
||||
setNeedsDisplay()
|
||||
}
|
||||
|
||||
/// Removes all DataSets (and thereby Entries) from the chart. Does not set the data object to nil. Also refreshes the chart by calling setNeedsDisplay().
|
||||
@objc open func clearValues()
|
||||
{
|
||||
_data?.clearValues()
|
||||
setNeedsDisplay()
|
||||
}
|
||||
|
||||
/// - returns: `true` if the chart is empty (meaning it's data object is either null or contains no entries).
|
||||
@objc open func isEmpty() -> Bool
|
||||
{
|
||||
guard let data = _data else { return true }
|
||||
|
||||
if data.entryCount <= 0
|
||||
{
|
||||
return true
|
||||
}
|
||||
else
|
||||
{
|
||||
return false
|
||||
}
|
||||
}
|
||||
|
||||
/// Lets the chart know its underlying data has changed and should perform all necessary recalculations.
|
||||
/// It is crucial that this method is called everytime data is changed dynamically. Not calling this method can lead to crashes or unexpected behaviour.
|
||||
@objc open func notifyDataSetChanged()
|
||||
{
|
||||
fatalError("notifyDataSetChanged() cannot be called on ChartViewBase")
|
||||
}
|
||||
|
||||
/// Calculates the offsets of the chart to the border depending on the position of an eventual legend or depending on the length of the y-axis and x-axis labels and their position
|
||||
internal func calculateOffsets()
|
||||
{
|
||||
fatalError("calculateOffsets() cannot be called on ChartViewBase")
|
||||
}
|
||||
|
||||
/// calcualtes the y-min and y-max value and the y-delta and x-delta value
|
||||
internal func calcMinMax()
|
||||
{
|
||||
fatalError("calcMinMax() cannot be called on ChartViewBase")
|
||||
}
|
||||
|
||||
/// calculates the required number of digits for the values that might be drawn in the chart (if enabled), and creates the default value formatter
|
||||
internal func setupDefaultFormatter(min: Double, max: Double)
|
||||
{
|
||||
// check if a custom formatter is set or not
|
||||
var reference = Double(0.0)
|
||||
|
||||
if let data = _data , data.entryCount >= 2
|
||||
{
|
||||
reference = fabs(max - min)
|
||||
}
|
||||
else
|
||||
{
|
||||
let absMin = fabs(min)
|
||||
let absMax = fabs(max)
|
||||
reference = absMin > absMax ? absMin : absMax
|
||||
}
|
||||
|
||||
|
||||
if _defaultValueFormatter is DefaultValueFormatter
|
||||
{
|
||||
// setup the formatter with a new number of digits
|
||||
let digits = reference.decimalPlaces
|
||||
|
||||
(_defaultValueFormatter as? DefaultValueFormatter)?.decimals
|
||||
= digits
|
||||
}
|
||||
}
|
||||
|
||||
open override func draw(_ rect: CGRect)
|
||||
{
|
||||
let optionalContext = NSUIGraphicsGetCurrentContext()
|
||||
guard let context = optionalContext else { return }
|
||||
|
||||
let frame = self.bounds
|
||||
|
||||
if _data === nil && noDataText.count > 0
|
||||
{
|
||||
context.saveGState()
|
||||
defer { context.restoreGState() }
|
||||
|
||||
let paragraphStyle = NSMutableParagraphStyle.default.mutableCopy() as! NSMutableParagraphStyle
|
||||
paragraphStyle.minimumLineHeight = noDataFont.lineHeight
|
||||
paragraphStyle.lineBreakMode = .byWordWrapping
|
||||
paragraphStyle.alignment = noDataTextAlignment
|
||||
|
||||
ChartUtils.drawMultilineText(
|
||||
context: context,
|
||||
text: noDataText,
|
||||
point: CGPoint(x: frame.width / 2.0, y: frame.height / 2.0),
|
||||
attributes:
|
||||
[.font: noDataFont,
|
||||
.foregroundColor: noDataTextColor,
|
||||
.paragraphStyle: paragraphStyle],
|
||||
constrainedToSize: self.bounds.size,
|
||||
anchor: CGPoint(x: 0.5, y: 0.5),
|
||||
angleRadians: 0.0)
|
||||
|
||||
return
|
||||
}
|
||||
|
||||
if !_offsetsCalculated
|
||||
{
|
||||
calculateOffsets()
|
||||
_offsetsCalculated = true
|
||||
}
|
||||
}
|
||||
|
||||
/// Draws the description text in the bottom right corner of the chart (per default)
|
||||
internal func drawDescription(context: CGContext)
|
||||
{
|
||||
// check if description should be drawn
|
||||
guard
|
||||
let description = chartDescription,
|
||||
description.isEnabled,
|
||||
let descriptionText = description.text,
|
||||
descriptionText.count > 0
|
||||
else { return }
|
||||
|
||||
let position = description.position ?? CGPoint(x: bounds.width - _viewPortHandler.offsetRight - description.xOffset,
|
||||
y: bounds.height - _viewPortHandler.offsetBottom - description.yOffset - description.font.lineHeight)
|
||||
|
||||
var attrs = [NSAttributedStringKey : Any]()
|
||||
|
||||
attrs[NSAttributedStringKey.font] = description.font
|
||||
attrs[NSAttributedStringKey.foregroundColor] = description.textColor
|
||||
|
||||
ChartUtils.drawText(
|
||||
context: context,
|
||||
text: descriptionText,
|
||||
point: position,
|
||||
align: description.textAlign,
|
||||
attributes: attrs)
|
||||
}
|
||||
|
||||
// MARK: - Highlighting
|
||||
|
||||
/// - returns: The array of currently highlighted values. This might an empty if nothing is highlighted.
|
||||
@objc open var highlighted: [Highlight]
|
||||
{
|
||||
return _indicesToHighlight
|
||||
}
|
||||
|
||||
/// Set this to false to prevent values from being highlighted by tap gesture.
|
||||
/// Values can still be highlighted via drag or programmatically.
|
||||
/// **default**: true
|
||||
@objc open var highlightPerTapEnabled: Bool
|
||||
{
|
||||
get { return _highlightPerTapEnabled }
|
||||
set { _highlightPerTapEnabled = newValue }
|
||||
}
|
||||
|
||||
/// - returns: `true` if values can be highlighted via tap gesture, `false` ifnot.
|
||||
@objc open var isHighLightPerTapEnabled: Bool
|
||||
{
|
||||
return highlightPerTapEnabled
|
||||
}
|
||||
|
||||
/// Checks if the highlight array is null, has a length of zero or if the first object is null.
|
||||
/// - returns: `true` if there are values to highlight, `false` ifthere are no values to highlight.
|
||||
@objc open func valuesToHighlight() -> Bool
|
||||
{
|
||||
return _indicesToHighlight.count > 0
|
||||
}
|
||||
|
||||
/// Highlights the values at the given indices in the given DataSets. Provide
|
||||
/// null or an empty array to undo all highlighting.
|
||||
/// This should be used to programmatically highlight values.
|
||||
/// This method *will not* call the delegate.
|
||||
@objc open func highlightValues(_ highs: [Highlight]?)
|
||||
{
|
||||
// set the indices to highlight
|
||||
_indicesToHighlight = highs ?? [Highlight]()
|
||||
|
||||
if _indicesToHighlight.isEmpty
|
||||
{
|
||||
self.lastHighlighted = nil
|
||||
}
|
||||
else
|
||||
{
|
||||
self.lastHighlighted = _indicesToHighlight[0]
|
||||
}
|
||||
|
||||
// redraw the chart
|
||||
setNeedsDisplay()
|
||||
}
|
||||
|
||||
/// Highlights any y-value at the given x-value in the given DataSet.
|
||||
/// Provide -1 as the dataSetIndex to undo all highlighting.
|
||||
/// This method will call the delegate.
|
||||
/// - parameter x: The x-value to highlight
|
||||
/// - parameter dataSetIndex: The dataset index to search in
|
||||
/// - parameter dataIndex: The data index to search in (only used in CombinedChartView currently)
|
||||
@objc open func highlightValue(x: Double, dataSetIndex: Int, dataIndex: Int = -1)
|
||||
{
|
||||
highlightValue(x: x, dataSetIndex: dataSetIndex, dataIndex: dataIndex, callDelegate: true)
|
||||
}
|
||||
|
||||
/// Highlights the value at the given x-value and y-value in the given DataSet.
|
||||
/// Provide -1 as the dataSetIndex to undo all highlighting.
|
||||
/// This method will call the delegate.
|
||||
/// - parameter x: The x-value to highlight
|
||||
/// - parameter y: The y-value to highlight. Supply `NaN` for "any"
|
||||
/// - parameter dataSetIndex: The dataset index to search in
|
||||
/// - parameter dataIndex: The data index to search in (only used in CombinedChartView currently)
|
||||
@objc open func highlightValue(x: Double, y: Double, dataSetIndex: Int, dataIndex: Int = -1)
|
||||
{
|
||||
highlightValue(x: x, y: y, dataSetIndex: dataSetIndex, dataIndex: dataIndex, callDelegate: true)
|
||||
}
|
||||
|
||||
/// Highlights any y-value at the given x-value in the given DataSet.
|
||||
/// Provide -1 as the dataSetIndex to undo all highlighting.
|
||||
/// - parameter x: The x-value to highlight
|
||||
/// - parameter dataSetIndex: The dataset index to search in
|
||||
/// - parameter dataIndex: The data index to search in (only used in CombinedChartView currently)
|
||||
/// - parameter callDelegate: Should the delegate be called for this change
|
||||
@objc open func highlightValue(x: Double, dataSetIndex: Int, dataIndex: Int = -1, callDelegate: Bool)
|
||||
{
|
||||
highlightValue(x: x, y: .nan, dataSetIndex: dataSetIndex, dataIndex: dataIndex, callDelegate: callDelegate)
|
||||
}
|
||||
|
||||
/// Highlights the value at the given x-value and y-value in the given DataSet.
|
||||
/// Provide -1 as the dataSetIndex to undo all highlighting.
|
||||
/// - parameter x: The x-value to highlight
|
||||
/// - parameter y: The y-value to highlight. Supply `NaN` for "any"
|
||||
/// - parameter dataSetIndex: The dataset index to search in
|
||||
/// - parameter dataIndex: The data index to search in (only used in CombinedChartView currently)
|
||||
/// - parameter callDelegate: Should the delegate be called for this change
|
||||
@objc open func highlightValue(x: Double, y: Double, dataSetIndex: Int, dataIndex: Int = -1, callDelegate: Bool)
|
||||
{
|
||||
guard let data = _data else
|
||||
{
|
||||
Swift.print("Value not highlighted because data is nil")
|
||||
return
|
||||
}
|
||||
|
||||
if dataSetIndex < 0 || dataSetIndex >= data.dataSetCount
|
||||
{
|
||||
highlightValue(nil, callDelegate: callDelegate)
|
||||
}
|
||||
else
|
||||
{
|
||||
highlightValue(Highlight(x: x, y: y, dataSetIndex: dataSetIndex, dataIndex: dataIndex), callDelegate: callDelegate)
|
||||
}
|
||||
}
|
||||
|
||||
/// Highlights the values represented by the provided Highlight object
|
||||
/// This method *will not* call the delegate.
|
||||
/// - parameter highlight: contains information about which entry should be highlighted
|
||||
@objc open func highlightValue(_ highlight: Highlight?)
|
||||
{
|
||||
highlightValue(highlight, callDelegate: false)
|
||||
}
|
||||
|
||||
/// Highlights the value selected by touch gesture.
|
||||
@objc open func highlightValue(_ highlight: Highlight?, callDelegate: Bool)
|
||||
{
|
||||
var entry: ChartDataEntry?
|
||||
var h = highlight
|
||||
|
||||
if h == nil
|
||||
{
|
||||
self.lastHighlighted = nil
|
||||
_indicesToHighlight.removeAll(keepingCapacity: false)
|
||||
}
|
||||
else
|
||||
{
|
||||
// set the indices to highlight
|
||||
entry = _data?.entryForHighlight(h!)
|
||||
if entry == nil
|
||||
{
|
||||
h = nil
|
||||
_indicesToHighlight.removeAll(keepingCapacity: false)
|
||||
}
|
||||
else
|
||||
{
|
||||
_indicesToHighlight = [h!]
|
||||
}
|
||||
}
|
||||
|
||||
if callDelegate, let delegate = delegate
|
||||
{
|
||||
if let h = h
|
||||
{
|
||||
// notify the listener
|
||||
delegate.chartValueSelected?(self, entry: entry!, highlight: h)
|
||||
}
|
||||
else
|
||||
{
|
||||
delegate.chartValueNothingSelected?(self)
|
||||
}
|
||||
}
|
||||
|
||||
// redraw the chart
|
||||
setNeedsDisplay()
|
||||
}
|
||||
|
||||
/// - returns: The Highlight object (contains x-index and DataSet index) of the
|
||||
/// selected value at the given touch point inside the Line-, Scatter-, or
|
||||
/// CandleStick-Chart.
|
||||
@objc open func getHighlightByTouchPoint(_ pt: CGPoint) -> Highlight?
|
||||
{
|
||||
if _data === nil
|
||||
{
|
||||
Swift.print("Can't select by touch. No data set.")
|
||||
return nil
|
||||
}
|
||||
|
||||
return self.highlighter?.getHighlight(x: pt.x, y: pt.y)
|
||||
}
|
||||
|
||||
/// The last value that was highlighted via touch.
|
||||
@objc open var lastHighlighted: Highlight?
|
||||
|
||||
// MARK: - Markers
|
||||
|
||||
/// draws all MarkerViews on the highlighted positions
|
||||
internal func drawMarkers(context: CGContext)
|
||||
{
|
||||
// if there is no marker view or drawing marker is disabled
|
||||
guard
|
||||
let marker = marker
|
||||
, isDrawMarkersEnabled &&
|
||||
valuesToHighlight()
|
||||
else { return }
|
||||
|
||||
for i in 0 ..< _indicesToHighlight.count
|
||||
{
|
||||
let highlight = _indicesToHighlight[i]
|
||||
|
||||
guard let
|
||||
set = data?.getDataSetByIndex(highlight.dataSetIndex),
|
||||
let e = _data?.entryForHighlight(highlight)
|
||||
else { continue }
|
||||
|
||||
let entryIndex = set.entryIndex(entry: e)
|
||||
if entryIndex > Int(Double(set.entryCount) * _animator.phaseX)
|
||||
{
|
||||
continue
|
||||
}
|
||||
|
||||
let pos = getMarkerPosition(highlight: highlight)
|
||||
|
||||
// check bounds
|
||||
if !_viewPortHandler.isInBounds(x: pos.x, y: pos.y)
|
||||
{
|
||||
continue
|
||||
}
|
||||
|
||||
// callbacks to update the content
|
||||
marker.refreshContent(entry: e, highlight: highlight)
|
||||
|
||||
// draw the marker
|
||||
marker.draw(context: context, point: pos)
|
||||
}
|
||||
}
|
||||
|
||||
/// - returns: The actual position in pixels of the MarkerView for the given Entry in the given DataSet.
|
||||
@objc open func getMarkerPosition(highlight: Highlight) -> CGPoint
|
||||
{
|
||||
return CGPoint(x: highlight.drawX, y: highlight.drawY)
|
||||
}
|
||||
|
||||
// MARK: - Animation
|
||||
|
||||
/// - returns: The animator responsible for animating chart values.
|
||||
@objc open var chartAnimator: Animator!
|
||||
{
|
||||
return _animator
|
||||
}
|
||||
|
||||
/// Animates the drawing / rendering of the chart on both x- and y-axis with the specified animation time.
|
||||
/// If `animate(...)` is called, no further calling of `invalidate()` is necessary to refresh the chart.
|
||||
/// - parameter xAxisDuration: duration for animating the x axis
|
||||
/// - parameter yAxisDuration: duration for animating the y axis
|
||||
/// - parameter easingX: an easing function for the animation on the x axis
|
||||
/// - parameter easingY: an easing function for the animation on the y axis
|
||||
@objc open func animate(xAxisDuration: TimeInterval, yAxisDuration: TimeInterval, easingX: ChartEasingFunctionBlock?, easingY: ChartEasingFunctionBlock?)
|
||||
{
|
||||
_animator.animate(xAxisDuration: xAxisDuration, yAxisDuration: yAxisDuration, easingX: easingX, easingY: easingY)
|
||||
}
|
||||
|
||||
/// Animates the drawing / rendering of the chart on both x- and y-axis with the specified animation time.
|
||||
/// If `animate(...)` is called, no further calling of `invalidate()` is necessary to refresh the chart.
|
||||
/// - parameter xAxisDuration: duration for animating the x axis
|
||||
/// - parameter yAxisDuration: duration for animating the y axis
|
||||
/// - parameter easingOptionX: the easing function for the animation on the x axis
|
||||
/// - parameter easingOptionY: the easing function for the animation on the y axis
|
||||
@objc open func animate(xAxisDuration: TimeInterval, yAxisDuration: TimeInterval, easingOptionX: ChartEasingOption, easingOptionY: ChartEasingOption)
|
||||
{
|
||||
_animator.animate(xAxisDuration: xAxisDuration, yAxisDuration: yAxisDuration, easingOptionX: easingOptionX, easingOptionY: easingOptionY)
|
||||
}
|
||||
|
||||
/// Animates the drawing / rendering of the chart on both x- and y-axis with the specified animation time.
|
||||
/// If `animate(...)` is called, no further calling of `invalidate()` is necessary to refresh the chart.
|
||||
/// - parameter xAxisDuration: duration for animating the x axis
|
||||
/// - parameter yAxisDuration: duration for animating the y axis
|
||||
/// - parameter easing: an easing function for the animation
|
||||
@objc open func animate(xAxisDuration: TimeInterval, yAxisDuration: TimeInterval, easing: ChartEasingFunctionBlock?)
|
||||
{
|
||||
_animator.animate(xAxisDuration: xAxisDuration, yAxisDuration: yAxisDuration, easing: easing)
|
||||
}
|
||||
|
||||
/// Animates the drawing / rendering of the chart on both x- and y-axis with the specified animation time.
|
||||
/// If `animate(...)` is called, no further calling of `invalidate()` is necessary to refresh the chart.
|
||||
/// - parameter xAxisDuration: duration for animating the x axis
|
||||
/// - parameter yAxisDuration: duration for animating the y axis
|
||||
/// - parameter easingOption: the easing function for the animation
|
||||
@objc open func animate(xAxisDuration: TimeInterval, yAxisDuration: TimeInterval, easingOption: ChartEasingOption)
|
||||
{
|
||||
_animator.animate(xAxisDuration: xAxisDuration, yAxisDuration: yAxisDuration, easingOption: easingOption)
|
||||
}
|
||||
|
||||
/// Animates the drawing / rendering of the chart on both x- and y-axis with the specified animation time.
|
||||
/// If `animate(...)` is called, no further calling of `invalidate()` is necessary to refresh the chart.
|
||||
/// - parameter xAxisDuration: duration for animating the x axis
|
||||
/// - parameter yAxisDuration: duration for animating the y axis
|
||||
@objc open func animate(xAxisDuration: TimeInterval, yAxisDuration: TimeInterval)
|
||||
{
|
||||
_animator.animate(xAxisDuration: xAxisDuration, yAxisDuration: yAxisDuration)
|
||||
}
|
||||
|
||||
/// Animates the drawing / rendering of the chart the x-axis with the specified animation time.
|
||||
/// If `animate(...)` is called, no further calling of `invalidate()` is necessary to refresh the chart.
|
||||
/// - parameter xAxisDuration: duration for animating the x axis
|
||||
/// - parameter easing: an easing function for the animation
|
||||
@objc open func animate(xAxisDuration: TimeInterval, easing: ChartEasingFunctionBlock?)
|
||||
{
|
||||
_animator.animate(xAxisDuration: xAxisDuration, easing: easing)
|
||||
}
|
||||
|
||||
/// Animates the drawing / rendering of the chart the x-axis with the specified animation time.
|
||||
/// If `animate(...)` is called, no further calling of `invalidate()` is necessary to refresh the chart.
|
||||
/// - parameter xAxisDuration: duration for animating the x axis
|
||||
/// - parameter easingOption: the easing function for the animation
|
||||
@objc open func animate(xAxisDuration: TimeInterval, easingOption: ChartEasingOption)
|
||||
{
|
||||
_animator.animate(xAxisDuration: xAxisDuration, easingOption: easingOption)
|
||||
}
|
||||
|
||||
/// Animates the drawing / rendering of the chart the x-axis with the specified animation time.
|
||||
/// If `animate(...)` is called, no further calling of `invalidate()` is necessary to refresh the chart.
|
||||
/// - parameter xAxisDuration: duration for animating the x axis
|
||||
@objc open func animate(xAxisDuration: TimeInterval)
|
||||
{
|
||||
_animator.animate(xAxisDuration: xAxisDuration)
|
||||
}
|
||||
|
||||
/// Animates the drawing / rendering of the chart the y-axis with the specified animation time.
|
||||
/// If `animate(...)` is called, no further calling of `invalidate()` is necessary to refresh the chart.
|
||||
/// - parameter yAxisDuration: duration for animating the y axis
|
||||
/// - parameter easing: an easing function for the animation
|
||||
@objc open func animate(yAxisDuration: TimeInterval, easing: ChartEasingFunctionBlock?)
|
||||
{
|
||||
_animator.animate(yAxisDuration: yAxisDuration, easing: easing)
|
||||
}
|
||||
|
||||
/// Animates the drawing / rendering of the chart the y-axis with the specified animation time.
|
||||
/// If `animate(...)` is called, no further calling of `invalidate()` is necessary to refresh the chart.
|
||||
/// - parameter yAxisDuration: duration for animating the y axis
|
||||
/// - parameter easingOption: the easing function for the animation
|
||||
@objc open func animate(yAxisDuration: TimeInterval, easingOption: ChartEasingOption)
|
||||
{
|
||||
_animator.animate(yAxisDuration: yAxisDuration, easingOption: easingOption)
|
||||
}
|
||||
|
||||
/// Animates the drawing / rendering of the chart the y-axis with the specified animation time.
|
||||
/// If `animate(...)` is called, no further calling of `invalidate()` is necessary to refresh the chart.
|
||||
/// - parameter yAxisDuration: duration for animating the y axis
|
||||
@objc open func animate(yAxisDuration: TimeInterval)
|
||||
{
|
||||
_animator.animate(yAxisDuration: yAxisDuration)
|
||||
}
|
||||
|
||||
// MARK: - Accessors
|
||||
|
||||
/// - returns: The current y-max value across all DataSets
|
||||
open var chartYMax: Double
|
||||
{
|
||||
return _data?.yMax ?? 0.0
|
||||
}
|
||||
|
||||
/// - returns: The current y-min value across all DataSets
|
||||
open var chartYMin: Double
|
||||
{
|
||||
return _data?.yMin ?? 0.0
|
||||
}
|
||||
|
||||
open var chartXMax: Double
|
||||
{
|
||||
return _xAxis._axisMaximum
|
||||
}
|
||||
|
||||
open var chartXMin: Double
|
||||
{
|
||||
return _xAxis._axisMinimum
|
||||
}
|
||||
|
||||
open var xRange: Double
|
||||
{
|
||||
return _xAxis.axisRange
|
||||
}
|
||||
|
||||
/// *
|
||||
/// - note: (Equivalent of getCenter() in MPAndroidChart, as center is already a standard in iOS that returns the center point relative to superview, and MPAndroidChart returns relative to self)*
|
||||
/// - returns: The center point of the chart (the whole View) in pixels.
|
||||
@objc open var midPoint: CGPoint
|
||||
{
|
||||
let bounds = self.bounds
|
||||
return CGPoint(x: bounds.origin.x + bounds.size.width / 2.0, y: bounds.origin.y + bounds.size.height / 2.0)
|
||||
}
|
||||
|
||||
/// - returns: The center of the chart taking offsets under consideration. (returns the center of the content rectangle)
|
||||
open var centerOffsets: CGPoint
|
||||
{
|
||||
return _viewPortHandler.contentCenter
|
||||
}
|
||||
|
||||
/// - returns: The Legend object of the chart. This method can be used to get an instance of the legend in order to customize the automatically generated Legend.
|
||||
@objc open var legend: Legend
|
||||
{
|
||||
return _legend
|
||||
}
|
||||
|
||||
/// - returns: The renderer object responsible for rendering / drawing the Legend.
|
||||
@objc open var legendRenderer: LegendRenderer!
|
||||
{
|
||||
return _legendRenderer
|
||||
}
|
||||
|
||||
/// - returns: The rectangle that defines the borders of the chart-value surface (into which the actual values are drawn).
|
||||
@objc open var contentRect: CGRect
|
||||
{
|
||||
return _viewPortHandler.contentRect
|
||||
}
|
||||
|
||||
/// - returns: The ViewPortHandler of the chart that is responsible for the
|
||||
/// content area of the chart and its offsets and dimensions.
|
||||
@objc open var viewPortHandler: ViewPortHandler!
|
||||
{
|
||||
return _viewPortHandler
|
||||
}
|
||||
|
||||
/// - returns: The bitmap that represents the chart.
|
||||
@objc open func getChartImage(transparent: Bool) -> NSUIImage?
|
||||
{
|
||||
NSUIGraphicsBeginImageContextWithOptions(bounds.size, isOpaque || !transparent, NSUIMainScreen()?.nsuiScale ?? 1.0)
|
||||
|
||||
guard let context = NSUIGraphicsGetCurrentContext()
|
||||
else { return nil }
|
||||
|
||||
let rect = CGRect(origin: CGPoint(x: 0, y: 0), size: bounds.size)
|
||||
|
||||
if isOpaque || !transparent
|
||||
{
|
||||
// Background color may be partially transparent, we must fill with white if we want to output an opaque image
|
||||
context.setFillColor(NSUIColor.white.cgColor)
|
||||
context.fill(rect)
|
||||
|
||||
if let backgroundColor = self.backgroundColor
|
||||
{
|
||||
context.setFillColor(backgroundColor.cgColor)
|
||||
context.fill(rect)
|
||||
}
|
||||
}
|
||||
|
||||
nsuiLayer?.render(in: context)
|
||||
|
||||
let image = NSUIGraphicsGetImageFromCurrentImageContext()
|
||||
|
||||
NSUIGraphicsEndImageContext()
|
||||
|
||||
return image
|
||||
}
|
||||
|
||||
public enum ImageFormat
|
||||
{
|
||||
case jpeg
|
||||
case png
|
||||
}
|
||||
|
||||
/// Saves the current chart state with the given name to the given path on
|
||||
/// the sdcard leaving the path empty "" will put the saved file directly on
|
||||
/// the SD card chart is saved as a PNG image, example:
|
||||
/// saveToPath("myfilename", "foldername1/foldername2")
|
||||
///
|
||||
/// - parameter to: path to the image to save
|
||||
/// - parameter format: the format to save
|
||||
/// - parameter compressionQuality: compression quality for lossless formats (JPEG)
|
||||
///
|
||||
/// - returns: `true` if the image was saved successfully
|
||||
open func save(to path: String, format: ImageFormat, compressionQuality: Double) -> Bool
|
||||
{
|
||||
guard let image = getChartImage(transparent: format != .jpeg) else { return false }
|
||||
|
||||
let imageData: Data?
|
||||
switch (format)
|
||||
{
|
||||
case .png: imageData = NSUIImagePNGRepresentation(image)
|
||||
case .jpeg: imageData = NSUIImageJPEGRepresentation(image, CGFloat(compressionQuality))
|
||||
}
|
||||
|
||||
guard let data = imageData else { return false }
|
||||
|
||||
do
|
||||
{
|
||||
try data.write(to: URL(fileURLWithPath: path), options: .atomic)
|
||||
}
|
||||
catch
|
||||
{
|
||||
return false
|
||||
}
|
||||
|
||||
return true
|
||||
}
|
||||
|
||||
internal var _viewportJobs = [ViewPortJob]()
|
||||
|
||||
open override func observeValue(forKeyPath keyPath: String?, of object: Any?, change: [NSKeyValueChangeKey : Any]?, context: UnsafeMutableRawPointer?)
|
||||
{
|
||||
if keyPath == "bounds" || keyPath == "frame"
|
||||
{
|
||||
let bounds = self.bounds
|
||||
|
||||
if (_viewPortHandler !== nil &&
|
||||
(bounds.size.width != _viewPortHandler.chartWidth ||
|
||||
bounds.size.height != _viewPortHandler.chartHeight))
|
||||
{
|
||||
_viewPortHandler.setChartDimens(width: bounds.size.width, height: bounds.size.height)
|
||||
|
||||
// This may cause the chart view to mutate properties affecting the view port -- lets do this
|
||||
// before we try to run any pending jobs on the view port itself
|
||||
notifyDataSetChanged()
|
||||
|
||||
// Finish any pending viewport changes
|
||||
while (!_viewportJobs.isEmpty)
|
||||
{
|
||||
let job = _viewportJobs.remove(at: 0)
|
||||
job.doJob()
|
||||
}
|
||||
}
|
||||
}
|
||||
}
|
||||
|
||||
@objc open func removeViewportJob(_ job: ViewPortJob)
|
||||
{
|
||||
if let index = _viewportJobs.index(where: { $0 === job })
|
||||
{
|
||||
_viewportJobs.remove(at: index)
|
||||
}
|
||||
}
|
||||
|
||||
@objc open func clearAllViewportJobs()
|
||||
{
|
||||
_viewportJobs.removeAll(keepingCapacity: false)
|
||||
}
|
||||
|
||||
@objc open func addViewportJob(_ job: ViewPortJob)
|
||||
{
|
||||
if _viewPortHandler.hasChartDimens
|
||||
{
|
||||
job.doJob()
|
||||
}
|
||||
else
|
||||
{
|
||||
_viewportJobs.append(job)
|
||||
}
|
||||
}
|
||||
|
||||
/// **default**: true
|
||||
/// - returns: `true` if chart continues to scroll after touch up, `false` ifnot.
|
||||
@objc open var isDragDecelerationEnabled: Bool
|
||||
{
|
||||
return dragDecelerationEnabled
|
||||
}
|
||||
|
||||
/// Deceleration friction coefficient in [0 ; 1] interval, higher values indicate that speed will decrease slowly, for example if it set to 0, it will stop immediately.
|
||||
/// 1 is an invalid value, and will be converted to 0.999 automatically.
|
||||
///
|
||||
/// **default**: true
|
||||
@objc open var dragDecelerationFrictionCoef: CGFloat
|
||||
{
|
||||
get
|
||||
{
|
||||
return _dragDecelerationFrictionCoef
|
||||
}
|
||||
set
|
||||
{
|
||||
var val = newValue
|
||||
if val < 0.0
|
||||
{
|
||||
val = 0.0
|
||||
}
|
||||
if val >= 1.0
|
||||
{
|
||||
val = 0.999
|
||||
}
|
||||
|
||||
_dragDecelerationFrictionCoef = val
|
||||
}
|
||||
}
|
||||
|
||||
/// The maximum distance in screen pixels away from an entry causing it to highlight.
|
||||
/// **default**: 500.0
|
||||
open var maxHighlightDistance: CGFloat = 500.0
|
||||
|
||||
/// the number of maximum visible drawn values on the chart only active when `drawValuesEnabled` is enabled
|
||||
open var maxVisibleCount: Int
|
||||
{
|
||||
return Int(INT_MAX)
|
||||
}
|
||||
|
||||
// MARK: - AnimatorDelegate
|
||||
|
||||
open func animatorUpdated(_ chartAnimator: Animator)
|
||||
{
|
||||
setNeedsDisplay()
|
||||
}
|
||||
|
||||
open func animatorStopped(_ chartAnimator: Animator)
|
||||
{
|
||||
|
||||
}
|
||||
|
||||
// MARK: - Touches
|
||||
|
||||
open override func nsuiTouchesBegan(_ touches: Set<NSUITouch>, withEvent event: NSUIEvent?)
|
||||
{
|
||||
if !_interceptTouchEvents
|
||||
{
|
||||
super.nsuiTouchesBegan(touches, withEvent: event)
|
||||
}
|
||||
}
|
||||
|
||||
open override func nsuiTouchesMoved(_ touches: Set<NSUITouch>, withEvent event: NSUIEvent?)
|
||||
{
|
||||
if !_interceptTouchEvents
|
||||
{
|
||||
super.nsuiTouchesMoved(touches, withEvent: event)
|
||||
}
|
||||
}
|
||||
|
||||
open override func nsuiTouchesEnded(_ touches: Set<NSUITouch>, withEvent event: NSUIEvent?)
|
||||
{
|
||||
if !_interceptTouchEvents
|
||||
{
|
||||
super.nsuiTouchesEnded(touches, withEvent: event)
|
||||
}
|
||||
}
|
||||
|
||||
open override func nsuiTouchesCancelled(_ touches: Set<NSUITouch>?, withEvent event: NSUIEvent?)
|
||||
{
|
||||
if !_interceptTouchEvents
|
||||
{
|
||||
super.nsuiTouchesCancelled(touches, withEvent: event)
|
||||
}
|
||||
}
|
||||
}
|
||||
246
Pods/Charts/Source/Charts/Charts/CombinedChartView.swift
generated
Normal file
246
Pods/Charts/Source/Charts/Charts/CombinedChartView.swift
generated
Normal file
@@ -0,0 +1,246 @@
|
||||
//
|
||||
// CombinedChartView.swift
|
||||
// Charts
|
||||
//
|
||||
// Copyright 2015 Daniel Cohen Gindi & Philipp Jahoda
|
||||
// A port of MPAndroidChart for iOS
|
||||
// Licensed under Apache License 2.0
|
||||
//
|
||||
// https://github.com/danielgindi/Charts
|
||||
//
|
||||
|
||||
import Foundation
|
||||
import CoreGraphics
|
||||
|
||||
/// This chart class allows the combination of lines, bars, scatter and candle data all displayed in one chart area.
|
||||
open class CombinedChartView: BarLineChartViewBase, CombinedChartDataProvider
|
||||
{
|
||||
/// the fill-formatter used for determining the position of the fill-line
|
||||
internal var _fillFormatter: IFillFormatter!
|
||||
|
||||
/// enum that allows to specify the order in which the different data objects for the combined-chart are drawn
|
||||
@objc(CombinedChartDrawOrder)
|
||||
public enum DrawOrder: Int
|
||||
{
|
||||
case bar
|
||||
case bubble
|
||||
case line
|
||||
case candle
|
||||
case scatter
|
||||
}
|
||||
|
||||
open override func initialize()
|
||||
{
|
||||
super.initialize()
|
||||
|
||||
self.highlighter = CombinedHighlighter(chart: self, barDataProvider: self)
|
||||
|
||||
// Old default behaviour
|
||||
self.highlightFullBarEnabled = true
|
||||
|
||||
_fillFormatter = DefaultFillFormatter()
|
||||
|
||||
renderer = CombinedChartRenderer(chart: self, animator: _animator, viewPortHandler: _viewPortHandler)
|
||||
}
|
||||
|
||||
open override var data: ChartData?
|
||||
{
|
||||
get
|
||||
{
|
||||
return super.data
|
||||
}
|
||||
set
|
||||
{
|
||||
super.data = newValue
|
||||
|
||||
self.highlighter = CombinedHighlighter(chart: self, barDataProvider: self)
|
||||
|
||||
(renderer as? CombinedChartRenderer)?.createRenderers()
|
||||
renderer?.initBuffers()
|
||||
}
|
||||
}
|
||||
|
||||
@objc open var fillFormatter: IFillFormatter
|
||||
{
|
||||
get
|
||||
{
|
||||
return _fillFormatter
|
||||
}
|
||||
set
|
||||
{
|
||||
_fillFormatter = newValue
|
||||
if _fillFormatter == nil
|
||||
{
|
||||
_fillFormatter = DefaultFillFormatter()
|
||||
}
|
||||
}
|
||||
}
|
||||
|
||||
/// - returns: The Highlight object (contains x-index and DataSet index) of the selected value at the given touch point inside the CombinedChart.
|
||||
open override func getHighlightByTouchPoint(_ pt: CGPoint) -> Highlight?
|
||||
{
|
||||
if _data === nil
|
||||
{
|
||||
Swift.print("Can't select by touch. No data set.")
|
||||
return nil
|
||||
}
|
||||
|
||||
guard let h = self.highlighter?.getHighlight(x: pt.x, y: pt.y)
|
||||
else { return nil }
|
||||
|
||||
if !isHighlightFullBarEnabled { return h }
|
||||
|
||||
// For isHighlightFullBarEnabled, remove stackIndex
|
||||
return Highlight(
|
||||
x: h.x, y: h.y,
|
||||
xPx: h.xPx, yPx: h.yPx,
|
||||
dataIndex: h.dataIndex,
|
||||
dataSetIndex: h.dataSetIndex,
|
||||
stackIndex: -1,
|
||||
axis: h.axis)
|
||||
}
|
||||
|
||||
// MARK: - CombinedChartDataProvider
|
||||
|
||||
open var combinedData: CombinedChartData?
|
||||
{
|
||||
get
|
||||
{
|
||||
return _data as? CombinedChartData
|
||||
}
|
||||
}
|
||||
|
||||
// MARK: - LineChartDataProvider
|
||||
|
||||
open var lineData: LineChartData?
|
||||
{
|
||||
get
|
||||
{
|
||||
return combinedData?.lineData
|
||||
}
|
||||
}
|
||||
|
||||
// MARK: - BarChartDataProvider
|
||||
|
||||
open var barData: BarChartData?
|
||||
{
|
||||
get
|
||||
{
|
||||
return combinedData?.barData
|
||||
}
|
||||
}
|
||||
|
||||
// MARK: - ScatterChartDataProvider
|
||||
|
||||
open var scatterData: ScatterChartData?
|
||||
{
|
||||
get
|
||||
{
|
||||
return combinedData?.scatterData
|
||||
}
|
||||
}
|
||||
|
||||
// MARK: - CandleChartDataProvider
|
||||
|
||||
open var candleData: CandleChartData?
|
||||
{
|
||||
get
|
||||
{
|
||||
return combinedData?.candleData
|
||||
}
|
||||
}
|
||||
|
||||
// MARK: - BubbleChartDataProvider
|
||||
|
||||
open var bubbleData: BubbleChartData?
|
||||
{
|
||||
get
|
||||
{
|
||||
return combinedData?.bubbleData
|
||||
}
|
||||
}
|
||||
|
||||
// MARK: - Accessors
|
||||
|
||||
/// if set to true, all values are drawn above their bars, instead of below their top
|
||||
@objc open var drawValueAboveBarEnabled: Bool
|
||||
{
|
||||
get { return (renderer as! CombinedChartRenderer).drawValueAboveBarEnabled }
|
||||
set { (renderer as! CombinedChartRenderer).drawValueAboveBarEnabled = newValue }
|
||||
}
|
||||
|
||||
/// if set to true, a grey area is drawn behind each bar that indicates the maximum value
|
||||
@objc open var drawBarShadowEnabled: Bool
|
||||
{
|
||||
get { return (renderer as! CombinedChartRenderer).drawBarShadowEnabled }
|
||||
set { (renderer as! CombinedChartRenderer).drawBarShadowEnabled = newValue }
|
||||
}
|
||||
|
||||
/// - returns: `true` if drawing values above bars is enabled, `false` ifnot
|
||||
open var isDrawValueAboveBarEnabled: Bool { return (renderer as! CombinedChartRenderer).drawValueAboveBarEnabled }
|
||||
|
||||
/// - returns: `true` if drawing shadows (maxvalue) for each bar is enabled, `false` ifnot
|
||||
open var isDrawBarShadowEnabled: Bool { return (renderer as! CombinedChartRenderer).drawBarShadowEnabled }
|
||||
|
||||
/// the order in which the provided data objects should be drawn.
|
||||
/// The earlier you place them in the provided array, the further they will be in the background.
|
||||
/// e.g. if you provide [DrawOrder.Bar, DrawOrder.Line], the bars will be drawn behind the lines.
|
||||
@objc open var drawOrder: [Int]
|
||||
{
|
||||
get
|
||||
{
|
||||
return (renderer as! CombinedChartRenderer).drawOrder.map { $0.rawValue }
|
||||
}
|
||||
set
|
||||
{
|
||||
(renderer as! CombinedChartRenderer).drawOrder = newValue.map { DrawOrder(rawValue: $0)! }
|
||||
}
|
||||
}
|
||||
|
||||
/// Set this to `true` to make the highlight operation full-bar oriented, `false` to make it highlight single values
|
||||
@objc open var highlightFullBarEnabled: Bool = false
|
||||
|
||||
/// - returns: `true` the highlight is be full-bar oriented, `false` ifsingle-value
|
||||
open var isHighlightFullBarEnabled: Bool { return highlightFullBarEnabled }
|
||||
|
||||
// MARK: - ChartViewBase
|
||||
|
||||
/// draws all MarkerViews on the highlighted positions
|
||||
override func drawMarkers(context: CGContext)
|
||||
{
|
||||
guard
|
||||
let marker = marker,
|
||||
isDrawMarkersEnabled && valuesToHighlight()
|
||||
else { return }
|
||||
|
||||
for i in 0 ..< _indicesToHighlight.count
|
||||
{
|
||||
let highlight = _indicesToHighlight[i]
|
||||
|
||||
guard
|
||||
let set = combinedData?.getDataSetByHighlight(highlight),
|
||||
let e = _data?.entryForHighlight(highlight)
|
||||
else { continue }
|
||||
|
||||
let entryIndex = set.entryIndex(entry: e)
|
||||
if entryIndex > Int(Double(set.entryCount) * _animator.phaseX)
|
||||
{
|
||||
continue
|
||||
}
|
||||
|
||||
let pos = getMarkerPosition(highlight: highlight)
|
||||
|
||||
// check bounds
|
||||
if !_viewPortHandler.isInBounds(x: pos.x, y: pos.y)
|
||||
{
|
||||
continue
|
||||
}
|
||||
|
||||
// callbacks to update the content
|
||||
marker.refreshContent(entry: e, highlight: highlight)
|
||||
|
||||
// draw the marker
|
||||
marker.draw(context: context, point: pos)
|
||||
}
|
||||
}
|
||||
}
|
||||
274
Pods/Charts/Source/Charts/Charts/HorizontalBarChartView.swift
generated
Normal file
274
Pods/Charts/Source/Charts/Charts/HorizontalBarChartView.swift
generated
Normal file
@@ -0,0 +1,274 @@
|
||||
//
|
||||
// HorizontalBarChartView.swift
|
||||
// Charts
|
||||
//
|
||||
// Copyright 2015 Daniel Cohen Gindi & Philipp Jahoda
|
||||
// A port of MPAndroidChart for iOS
|
||||
// Licensed under Apache License 2.0
|
||||
//
|
||||
// https://github.com/danielgindi/Charts
|
||||
//
|
||||
|
||||
import Foundation
|
||||
import CoreGraphics
|
||||
|
||||
#if !os(OSX)
|
||||
import UIKit
|
||||
#endif
|
||||
|
||||
/// BarChart with horizontal bar orientation. In this implementation, x- and y-axis are switched.
|
||||
open class HorizontalBarChartView: BarChartView
|
||||
{
|
||||
internal override func initialize()
|
||||
{
|
||||
super.initialize()
|
||||
|
||||
_leftAxisTransformer = TransformerHorizontalBarChart(viewPortHandler: _viewPortHandler)
|
||||
_rightAxisTransformer = TransformerHorizontalBarChart(viewPortHandler: _viewPortHandler)
|
||||
|
||||
renderer = HorizontalBarChartRenderer(dataProvider: self, animator: _animator, viewPortHandler: _viewPortHandler)
|
||||
leftYAxisRenderer = YAxisRendererHorizontalBarChart(viewPortHandler: _viewPortHandler, yAxis: leftAxis, transformer: _leftAxisTransformer)
|
||||
rightYAxisRenderer = YAxisRendererHorizontalBarChart(viewPortHandler: _viewPortHandler, yAxis: rightAxis, transformer: _rightAxisTransformer)
|
||||
xAxisRenderer = XAxisRendererHorizontalBarChart(viewPortHandler: _viewPortHandler, xAxis: _xAxis, transformer: _leftAxisTransformer, chart: self)
|
||||
|
||||
self.highlighter = HorizontalBarHighlighter(chart: self)
|
||||
}
|
||||
|
||||
internal override func calculateLegendOffsets(offsetLeft: inout CGFloat, offsetTop: inout CGFloat, offsetRight: inout CGFloat, offsetBottom: inout CGFloat)
|
||||
{
|
||||
guard
|
||||
let legend = _legend,
|
||||
legend.isEnabled,
|
||||
legend.drawInside
|
||||
else { return }
|
||||
|
||||
// setup offsets for legend
|
||||
switch legend.orientation
|
||||
{
|
||||
case .vertical:
|
||||
switch legend.horizontalAlignment
|
||||
{
|
||||
case .left:
|
||||
offsetLeft += min(legend.neededWidth, _viewPortHandler.chartWidth * legend.maxSizePercent) + legend.xOffset
|
||||
|
||||
case .right:
|
||||
offsetRight += min(legend.neededWidth, _viewPortHandler.chartWidth * legend.maxSizePercent) + legend.xOffset
|
||||
|
||||
case .center:
|
||||
|
||||
switch legend.verticalAlignment
|
||||
{
|
||||
case .top:
|
||||
offsetTop += min(legend.neededHeight, _viewPortHandler.chartHeight * legend.maxSizePercent) + legend.yOffset
|
||||
|
||||
case .bottom:
|
||||
offsetBottom += min(legend.neededHeight, _viewPortHandler.chartHeight * legend.maxSizePercent) + legend.yOffset
|
||||
|
||||
default:
|
||||
break
|
||||
}
|
||||
}
|
||||
|
||||
case .horizontal:
|
||||
switch legend.verticalAlignment
|
||||
{
|
||||
case .top:
|
||||
offsetTop += min(legend.neededHeight, _viewPortHandler.chartHeight * legend.maxSizePercent) + legend.yOffset
|
||||
|
||||
// left axis equals the top x-axis in a horizontal chart
|
||||
if leftAxis.isEnabled && leftAxis.isDrawLabelsEnabled
|
||||
{
|
||||
offsetTop += leftAxis.getRequiredHeightSpace()
|
||||
}
|
||||
|
||||
case .bottom:
|
||||
offsetBottom += min(legend.neededHeight, _viewPortHandler.chartHeight * legend.maxSizePercent) + legend.yOffset
|
||||
|
||||
// right axis equals the bottom x-axis in a horizontal chart
|
||||
if rightAxis.isEnabled && rightAxis.isDrawLabelsEnabled
|
||||
{
|
||||
offsetBottom += rightAxis.getRequiredHeightSpace()
|
||||
}
|
||||
default:
|
||||
break
|
||||
}
|
||||
}
|
||||
}
|
||||
|
||||
internal override func calculateOffsets()
|
||||
{
|
||||
var offsetLeft: CGFloat = 0.0,
|
||||
offsetRight: CGFloat = 0.0,
|
||||
offsetTop: CGFloat = 0.0,
|
||||
offsetBottom: CGFloat = 0.0
|
||||
|
||||
calculateLegendOffsets(offsetLeft: &offsetLeft,
|
||||
offsetTop: &offsetTop,
|
||||
offsetRight: &offsetRight,
|
||||
offsetBottom: &offsetBottom)
|
||||
|
||||
// offsets for y-labels
|
||||
if leftAxis.needsOffset
|
||||
{
|
||||
offsetTop += leftAxis.getRequiredHeightSpace()
|
||||
}
|
||||
|
||||
if rightAxis.needsOffset
|
||||
{
|
||||
offsetBottom += rightAxis.getRequiredHeightSpace()
|
||||
}
|
||||
|
||||
let xlabelwidth = _xAxis.labelRotatedWidth
|
||||
|
||||
if _xAxis.isEnabled
|
||||
{
|
||||
// offsets for x-labels
|
||||
if _xAxis.labelPosition == .bottom
|
||||
{
|
||||
offsetLeft += xlabelwidth
|
||||
}
|
||||
else if _xAxis.labelPosition == .top
|
||||
{
|
||||
offsetRight += xlabelwidth
|
||||
}
|
||||
else if _xAxis.labelPosition == .bothSided
|
||||
{
|
||||
offsetLeft += xlabelwidth
|
||||
offsetRight += xlabelwidth
|
||||
}
|
||||
}
|
||||
|
||||
offsetTop += self.extraTopOffset
|
||||
offsetRight += self.extraRightOffset
|
||||
offsetBottom += self.extraBottomOffset
|
||||
offsetLeft += self.extraLeftOffset
|
||||
|
||||
_viewPortHandler.restrainViewPort(
|
||||
offsetLeft: max(self.minOffset, offsetLeft),
|
||||
offsetTop: max(self.minOffset, offsetTop),
|
||||
offsetRight: max(self.minOffset, offsetRight),
|
||||
offsetBottom: max(self.minOffset, offsetBottom))
|
||||
|
||||
prepareOffsetMatrix()
|
||||
prepareValuePxMatrix()
|
||||
}
|
||||
|
||||
internal override func prepareValuePxMatrix()
|
||||
{
|
||||
_rightAxisTransformer.prepareMatrixValuePx(chartXMin: rightAxis._axisMinimum, deltaX: CGFloat(rightAxis.axisRange), deltaY: CGFloat(_xAxis.axisRange), chartYMin: _xAxis._axisMinimum)
|
||||
_leftAxisTransformer.prepareMatrixValuePx(chartXMin: leftAxis._axisMinimum, deltaX: CGFloat(leftAxis.axisRange), deltaY: CGFloat(_xAxis.axisRange), chartYMin: _xAxis._axisMinimum)
|
||||
}
|
||||
|
||||
open override func getMarkerPosition(highlight: Highlight) -> CGPoint
|
||||
{
|
||||
return CGPoint(x: highlight.drawY, y: highlight.drawX)
|
||||
}
|
||||
|
||||
open override func getBarBounds(entry e: BarChartDataEntry) -> CGRect
|
||||
{
|
||||
guard
|
||||
let data = _data as? BarChartData,
|
||||
let set = data.getDataSetForEntry(e) as? IBarChartDataSet
|
||||
else { return CGRect.null }
|
||||
|
||||
let y = e.y
|
||||
let x = e.x
|
||||
|
||||
let barWidth = data.barWidth
|
||||
|
||||
let top = x - 0.5 + barWidth / 2.0
|
||||
let bottom = x + 0.5 - barWidth / 2.0
|
||||
let left = y >= 0.0 ? y : 0.0
|
||||
let right = y <= 0.0 ? y : 0.0
|
||||
|
||||
var bounds = CGRect(x: left, y: top, width: right - left, height: bottom - top)
|
||||
|
||||
getTransformer(forAxis: set.axisDependency).rectValueToPixel(&bounds)
|
||||
|
||||
return bounds
|
||||
}
|
||||
|
||||
open override func getPosition(entry e: ChartDataEntry, axis: YAxis.AxisDependency) -> CGPoint
|
||||
{
|
||||
var vals = CGPoint(x: CGFloat(e.y), y: CGFloat(e.x))
|
||||
|
||||
getTransformer(forAxis: axis).pointValueToPixel(&vals)
|
||||
|
||||
return vals
|
||||
}
|
||||
|
||||
open override func getHighlightByTouchPoint(_ pt: CGPoint) -> Highlight?
|
||||
{
|
||||
if _data === nil
|
||||
{
|
||||
Swift.print("Can't select by touch. No data set.", terminator: "\n")
|
||||
return nil
|
||||
}
|
||||
|
||||
return self.highlighter?.getHighlight(x: pt.y, y: pt.x)
|
||||
}
|
||||
|
||||
/// - returns: The lowest x-index (value on the x-axis) that is still visible on he chart.
|
||||
open override var lowestVisibleX: Double
|
||||
{
|
||||
var pt = CGPoint(
|
||||
x: viewPortHandler.contentLeft,
|
||||
y: viewPortHandler.contentBottom)
|
||||
|
||||
getTransformer(forAxis: .left).pixelToValues(&pt)
|
||||
|
||||
return max(xAxis._axisMinimum, Double(pt.y))
|
||||
}
|
||||
|
||||
/// - returns: The highest x-index (value on the x-axis) that is still visible on the chart.
|
||||
open override var highestVisibleX: Double
|
||||
{
|
||||
var pt = CGPoint(
|
||||
x: viewPortHandler.contentLeft,
|
||||
y: viewPortHandler.contentTop)
|
||||
|
||||
getTransformer(forAxis: .left).pixelToValues(&pt)
|
||||
|
||||
return min(xAxis._axisMaximum, Double(pt.y))
|
||||
}
|
||||
|
||||
// MARK: - Viewport
|
||||
|
||||
open override func setVisibleXRangeMaximum(_ maxXRange: Double)
|
||||
{
|
||||
let xScale = xAxis.axisRange / maxXRange
|
||||
viewPortHandler.setMinimumScaleY(CGFloat(xScale))
|
||||
}
|
||||
|
||||
open override func setVisibleXRangeMinimum(_ minXRange: Double)
|
||||
{
|
||||
let xScale = xAxis.axisRange / minXRange
|
||||
viewPortHandler.setMaximumScaleY(CGFloat(xScale))
|
||||
}
|
||||
|
||||
open override func setVisibleXRange(minXRange: Double, maxXRange: Double)
|
||||
{
|
||||
let minScale = xAxis.axisRange / minXRange
|
||||
let maxScale = xAxis.axisRange / maxXRange
|
||||
viewPortHandler.setMinMaxScaleY(minScaleY: CGFloat(minScale), maxScaleY: CGFloat(maxScale))
|
||||
}
|
||||
|
||||
open override func setVisibleYRangeMaximum(_ maxYRange: Double, axis: YAxis.AxisDependency)
|
||||
{
|
||||
let yScale = getAxisRange(axis: axis) / maxYRange
|
||||
viewPortHandler.setMinimumScaleX(CGFloat(yScale))
|
||||
}
|
||||
|
||||
open override func setVisibleYRangeMinimum(_ minYRange: Double, axis: YAxis.AxisDependency)
|
||||
{
|
||||
let yScale = getAxisRange(axis: axis) / minYRange
|
||||
viewPortHandler.setMaximumScaleX(CGFloat(yScale))
|
||||
}
|
||||
|
||||
open override func setVisibleYRange(minYRange: Double, maxYRange: Double, axis: YAxis.AxisDependency)
|
||||
{
|
||||
let minScale = getAxisRange(axis: axis) / minYRange
|
||||
let maxScale = getAxisRange(axis: axis) / maxYRange
|
||||
viewPortHandler.setMinMaxScaleX(minScaleX: CGFloat(minScale), maxScaleX: CGFloat(maxScale))
|
||||
}
|
||||
}
|
||||
28
Pods/Charts/Source/Charts/Charts/LineChartView.swift
generated
Normal file
28
Pods/Charts/Source/Charts/Charts/LineChartView.swift
generated
Normal file
@@ -0,0 +1,28 @@
|
||||
//
|
||||
// LineChartView.swift
|
||||
// Charts
|
||||
//
|
||||
// Copyright 2015 Daniel Cohen Gindi & Philipp Jahoda
|
||||
// A port of MPAndroidChart for iOS
|
||||
// Licensed under Apache License 2.0
|
||||
//
|
||||
// https://github.com/danielgindi/Charts
|
||||
//
|
||||
|
||||
import Foundation
|
||||
import CoreGraphics
|
||||
|
||||
/// Chart that draws lines, surfaces, circles, ...
|
||||
open class LineChartView: BarLineChartViewBase, LineChartDataProvider
|
||||
{
|
||||
internal override func initialize()
|
||||
{
|
||||
super.initialize()
|
||||
|
||||
renderer = LineChartRenderer(dataProvider: self, animator: _animator, viewPortHandler: _viewPortHandler)
|
||||
}
|
||||
|
||||
// MARK: - LineChartDataProvider
|
||||
|
||||
open var lineData: LineChartData? { return _data as? LineChartData }
|
||||
}
|
||||
642
Pods/Charts/Source/Charts/Charts/PieChartView.swift
generated
Normal file
642
Pods/Charts/Source/Charts/Charts/PieChartView.swift
generated
Normal file
@@ -0,0 +1,642 @@
|
||||
//
|
||||
// PieChartView.swift
|
||||
// Charts
|
||||
//
|
||||
// Copyright 2015 Daniel Cohen Gindi & Philipp Jahoda
|
||||
// A port of MPAndroidChart for iOS
|
||||
// Licensed under Apache License 2.0
|
||||
//
|
||||
// https://github.com/danielgindi/Charts
|
||||
//
|
||||
|
||||
import Foundation
|
||||
import CoreGraphics
|
||||
|
||||
#if !os(OSX)
|
||||
import UIKit
|
||||
#endif
|
||||
|
||||
/// View that represents a pie chart. Draws cake like slices.
|
||||
open class PieChartView: PieRadarChartViewBase
|
||||
{
|
||||
/// rect object that represents the bounds of the piechart, needed for drawing the circle
|
||||
private var _circleBox = CGRect()
|
||||
|
||||
/// flag indicating if entry labels should be drawn or not
|
||||
private var _drawEntryLabelsEnabled = true
|
||||
|
||||
/// array that holds the width of each pie-slice in degrees
|
||||
private var _drawAngles = [CGFloat]()
|
||||
|
||||
/// array that holds the absolute angle in degrees of each slice
|
||||
private var _absoluteAngles = [CGFloat]()
|
||||
|
||||
/// if true, the hole inside the chart will be drawn
|
||||
private var _drawHoleEnabled = true
|
||||
|
||||
private var _holeColor: NSUIColor? = NSUIColor.white
|
||||
|
||||
/// Sets the color the entry labels are drawn with.
|
||||
private var _entryLabelColor: NSUIColor? = NSUIColor.white
|
||||
|
||||
/// Sets the font the entry labels are drawn with.
|
||||
private var _entryLabelFont: NSUIFont? = NSUIFont(name: "HelveticaNeue", size: 13.0)
|
||||
|
||||
/// if true, the hole will see-through to the inner tips of the slices
|
||||
private var _drawSlicesUnderHoleEnabled = false
|
||||
|
||||
/// if true, the values inside the piechart are drawn as percent values
|
||||
private var _usePercentValuesEnabled = false
|
||||
|
||||
/// variable for the text that is drawn in the center of the pie-chart
|
||||
private var _centerAttributedText: NSAttributedString?
|
||||
|
||||
/// the offset on the x- and y-axis the center text has in dp.
|
||||
private var _centerTextOffset: CGPoint = CGPoint()
|
||||
|
||||
/// indicates the size of the hole in the center of the piechart
|
||||
///
|
||||
/// **default**: `0.5`
|
||||
private var _holeRadiusPercent = CGFloat(0.5)
|
||||
|
||||
private var _transparentCircleColor: NSUIColor? = NSUIColor(white: 1.0, alpha: 105.0/255.0)
|
||||
|
||||
/// the radius of the transparent circle next to the chart-hole in the center
|
||||
private var _transparentCircleRadiusPercent = CGFloat(0.55)
|
||||
|
||||
/// if enabled, centertext is drawn
|
||||
private var _drawCenterTextEnabled = true
|
||||
|
||||
private var _centerTextRadiusPercent: CGFloat = 1.0
|
||||
|
||||
/// maximum angle for this pie
|
||||
private var _maxAngle: CGFloat = 360.0
|
||||
|
||||
public override init(frame: CGRect)
|
||||
{
|
||||
super.init(frame: frame)
|
||||
}
|
||||
|
||||
public required init?(coder aDecoder: NSCoder)
|
||||
{
|
||||
super.init(coder: aDecoder)
|
||||
}
|
||||
|
||||
internal override func initialize()
|
||||
{
|
||||
super.initialize()
|
||||
|
||||
renderer = PieChartRenderer(chart: self, animator: _animator, viewPortHandler: _viewPortHandler)
|
||||
_xAxis = nil
|
||||
|
||||
self.highlighter = PieHighlighter(chart: self)
|
||||
}
|
||||
|
||||
open override func draw(_ rect: CGRect)
|
||||
{
|
||||
super.draw(rect)
|
||||
|
||||
if _data === nil
|
||||
{
|
||||
return
|
||||
}
|
||||
|
||||
let optionalContext = NSUIGraphicsGetCurrentContext()
|
||||
guard let context = optionalContext, let renderer = renderer else
|
||||
{
|
||||
return
|
||||
}
|
||||
|
||||
renderer.drawData(context: context)
|
||||
|
||||
if (valuesToHighlight())
|
||||
{
|
||||
renderer.drawHighlighted(context: context, indices: _indicesToHighlight)
|
||||
}
|
||||
|
||||
renderer.drawExtras(context: context)
|
||||
|
||||
renderer.drawValues(context: context)
|
||||
|
||||
legendRenderer.renderLegend(context: context)
|
||||
|
||||
drawDescription(context: context)
|
||||
|
||||
drawMarkers(context: context)
|
||||
}
|
||||
|
||||
internal override func calculateOffsets()
|
||||
{
|
||||
super.calculateOffsets()
|
||||
|
||||
// prevent nullpointer when no data set
|
||||
if _data === nil
|
||||
{
|
||||
return
|
||||
}
|
||||
|
||||
let radius = diameter / 2.0
|
||||
|
||||
let c = self.centerOffsets
|
||||
|
||||
let shift = (data as? PieChartData)?.dataSet?.selectionShift ?? 0.0
|
||||
|
||||
// create the circle box that will contain the pie-chart (the bounds of the pie-chart)
|
||||
_circleBox.origin.x = (c.x - radius) + shift
|
||||
_circleBox.origin.y = (c.y - radius) + shift
|
||||
_circleBox.size.width = diameter - shift * 2.0
|
||||
_circleBox.size.height = diameter - shift * 2.0
|
||||
}
|
||||
|
||||
internal override func calcMinMax()
|
||||
{
|
||||
calcAngles()
|
||||
}
|
||||
|
||||
open override func getMarkerPosition(highlight: Highlight) -> CGPoint
|
||||
{
|
||||
let center = self.centerCircleBox
|
||||
var r = self.radius
|
||||
|
||||
var off = r / 10.0 * 3.6
|
||||
|
||||
if self.isDrawHoleEnabled
|
||||
{
|
||||
off = (r - (r * self.holeRadiusPercent)) / 2.0
|
||||
}
|
||||
|
||||
r -= off // offset to keep things inside the chart
|
||||
|
||||
let rotationAngle = self.rotationAngle
|
||||
|
||||
let entryIndex = Int(highlight.x)
|
||||
|
||||
// offset needed to center the drawn text in the slice
|
||||
let offset = drawAngles[entryIndex] / 2.0
|
||||
|
||||
// calculate the text position
|
||||
let x: CGFloat = (r * cos(((rotationAngle + absoluteAngles[entryIndex] - offset) * CGFloat(_animator.phaseY)).DEG2RAD) + center.x)
|
||||
let y: CGFloat = (r * sin(((rotationAngle + absoluteAngles[entryIndex] - offset) * CGFloat(_animator.phaseY)).DEG2RAD) + center.y)
|
||||
|
||||
return CGPoint(x: x, y: y)
|
||||
}
|
||||
|
||||
/// calculates the needed angles for the chart slices
|
||||
private func calcAngles()
|
||||
{
|
||||
_drawAngles = [CGFloat]()
|
||||
_absoluteAngles = [CGFloat]()
|
||||
|
||||
guard let data = _data else { return }
|
||||
|
||||
let entryCount = data.entryCount
|
||||
|
||||
_drawAngles.reserveCapacity(entryCount)
|
||||
_absoluteAngles.reserveCapacity(entryCount)
|
||||
|
||||
let yValueSum = (_data as! PieChartData).yValueSum
|
||||
|
||||
var dataSets = data.dataSets
|
||||
|
||||
var cnt = 0
|
||||
|
||||
for i in 0 ..< data.dataSetCount
|
||||
{
|
||||
let set = dataSets[i]
|
||||
let entryCount = set.entryCount
|
||||
|
||||
for j in 0 ..< entryCount
|
||||
{
|
||||
guard let e = set.entryForIndex(j) else { continue }
|
||||
|
||||
_drawAngles.append(calcAngle(value: abs(e.y), yValueSum: yValueSum))
|
||||
|
||||
if cnt == 0
|
||||
{
|
||||
_absoluteAngles.append(_drawAngles[cnt])
|
||||
}
|
||||
else
|
||||
{
|
||||
_absoluteAngles.append(_absoluteAngles[cnt - 1] + _drawAngles[cnt])
|
||||
}
|
||||
|
||||
cnt += 1
|
||||
}
|
||||
}
|
||||
}
|
||||
|
||||
/// Checks if the given index is set to be highlighted.
|
||||
@objc open func needsHighlight(index: Int) -> Bool
|
||||
{
|
||||
// no highlight
|
||||
if !valuesToHighlight()
|
||||
{
|
||||
return false
|
||||
}
|
||||
|
||||
for i in 0 ..< _indicesToHighlight.count
|
||||
{
|
||||
// check if the xvalue for the given dataset needs highlight
|
||||
if Int(_indicesToHighlight[i].x) == index
|
||||
{
|
||||
return true
|
||||
}
|
||||
}
|
||||
|
||||
return false
|
||||
}
|
||||
|
||||
/// calculates the needed angle for a given value
|
||||
private func calcAngle(_ value: Double) -> CGFloat
|
||||
{
|
||||
return calcAngle(value: value, yValueSum: (_data as! PieChartData).yValueSum)
|
||||
}
|
||||
|
||||
/// calculates the needed angle for a given value
|
||||
private func calcAngle(value: Double, yValueSum: Double) -> CGFloat
|
||||
{
|
||||
return CGFloat(value) / CGFloat(yValueSum) * _maxAngle
|
||||
}
|
||||
|
||||
/// This will throw an exception, PieChart has no XAxis object.
|
||||
open override var xAxis: XAxis
|
||||
{
|
||||
fatalError("PieChart has no XAxis")
|
||||
}
|
||||
|
||||
open override func indexForAngle(_ angle: CGFloat) -> Int
|
||||
{
|
||||
// take the current angle of the chart into consideration
|
||||
let a = (angle - self.rotationAngle).normalizedAngle
|
||||
for i in 0 ..< _absoluteAngles.count
|
||||
{
|
||||
if _absoluteAngles[i] > a
|
||||
{
|
||||
return i
|
||||
}
|
||||
}
|
||||
|
||||
return -1 // return -1 if no index found
|
||||
}
|
||||
|
||||
/// - returns: The index of the DataSet this x-index belongs to.
|
||||
@objc open func dataSetIndexForIndex(_ xValue: Double) -> Int
|
||||
{
|
||||
var dataSets = _data?.dataSets ?? []
|
||||
|
||||
for i in 0 ..< dataSets.count
|
||||
{
|
||||
if (dataSets[i].entryForXValue(xValue, closestToY: Double.nan) !== nil)
|
||||
{
|
||||
return i
|
||||
}
|
||||
}
|
||||
|
||||
return -1
|
||||
}
|
||||
|
||||
/// - returns: An integer array of all the different angles the chart slices
|
||||
/// have the angles in the returned array determine how much space (of 360°)
|
||||
/// each slice takes
|
||||
@objc open var drawAngles: [CGFloat]
|
||||
{
|
||||
return _drawAngles
|
||||
}
|
||||
|
||||
/// - returns: The absolute angles of the different chart slices (where the
|
||||
/// slices end)
|
||||
@objc open var absoluteAngles: [CGFloat]
|
||||
{
|
||||
return _absoluteAngles
|
||||
}
|
||||
|
||||
/// The color for the hole that is drawn in the center of the PieChart (if enabled).
|
||||
///
|
||||
/// - note: Use holeTransparent with holeColor = nil to make the hole transparent.*
|
||||
@objc open var holeColor: NSUIColor?
|
||||
{
|
||||
get
|
||||
{
|
||||
return _holeColor
|
||||
}
|
||||
set
|
||||
{
|
||||
_holeColor = newValue
|
||||
setNeedsDisplay()
|
||||
}
|
||||
}
|
||||
|
||||
/// if true, the hole will see-through to the inner tips of the slices
|
||||
///
|
||||
/// **default**: `false`
|
||||
@objc open var drawSlicesUnderHoleEnabled: Bool
|
||||
{
|
||||
get
|
||||
{
|
||||
return _drawSlicesUnderHoleEnabled
|
||||
}
|
||||
set
|
||||
{
|
||||
_drawSlicesUnderHoleEnabled = newValue
|
||||
setNeedsDisplay()
|
||||
}
|
||||
}
|
||||
|
||||
/// - returns: `true` if the inner tips of the slices are visible behind the hole, `false` if not.
|
||||
@objc open var isDrawSlicesUnderHoleEnabled: Bool
|
||||
{
|
||||
return drawSlicesUnderHoleEnabled
|
||||
}
|
||||
|
||||
/// `true` if the hole in the center of the pie-chart is set to be visible, `false` ifnot
|
||||
@objc open var drawHoleEnabled: Bool
|
||||
{
|
||||
get
|
||||
{
|
||||
return _drawHoleEnabled
|
||||
}
|
||||
set
|
||||
{
|
||||
_drawHoleEnabled = newValue
|
||||
setNeedsDisplay()
|
||||
}
|
||||
}
|
||||
|
||||
/// - returns: `true` if the hole in the center of the pie-chart is set to be visible, `false` ifnot
|
||||
@objc open var isDrawHoleEnabled: Bool
|
||||
{
|
||||
get
|
||||
{
|
||||
return drawHoleEnabled
|
||||
}
|
||||
}
|
||||
|
||||
/// the text that is displayed in the center of the pie-chart
|
||||
@objc open var centerText: String?
|
||||
{
|
||||
get
|
||||
{
|
||||
return self.centerAttributedText?.string
|
||||
}
|
||||
set
|
||||
{
|
||||
var attrString: NSMutableAttributedString?
|
||||
if newValue == nil
|
||||
{
|
||||
attrString = nil
|
||||
}
|
||||
else
|
||||
{
|
||||
#if os(OSX)
|
||||
let paragraphStyle = NSParagraphStyle.default.mutableCopy() as! NSMutableParagraphStyle
|
||||
paragraphStyle.lineBreakMode = NSParagraphStyle.LineBreakMode.byTruncatingTail
|
||||
#else
|
||||
let paragraphStyle = NSParagraphStyle.default.mutableCopy() as! NSMutableParagraphStyle
|
||||
paragraphStyle.lineBreakMode = NSLineBreakMode.byTruncatingTail
|
||||
#endif
|
||||
paragraphStyle.alignment = .center
|
||||
|
||||
attrString = NSMutableAttributedString(string: newValue!)
|
||||
attrString?.setAttributes([
|
||||
NSAttributedStringKey.foregroundColor: NSUIColor.black,
|
||||
NSAttributedStringKey.font: NSUIFont.systemFont(ofSize: 12.0),
|
||||
NSAttributedStringKey.paragraphStyle: paragraphStyle
|
||||
], range: NSMakeRange(0, attrString!.length))
|
||||
}
|
||||
self.centerAttributedText = attrString
|
||||
}
|
||||
}
|
||||
|
||||
/// the text that is displayed in the center of the pie-chart
|
||||
@objc open var centerAttributedText: NSAttributedString?
|
||||
{
|
||||
get
|
||||
{
|
||||
return _centerAttributedText
|
||||
}
|
||||
set
|
||||
{
|
||||
_centerAttributedText = newValue
|
||||
setNeedsDisplay()
|
||||
}
|
||||
}
|
||||
|
||||
/// Sets the offset the center text should have from it's original position in dp. Default x = 0, y = 0
|
||||
@objc open var centerTextOffset: CGPoint
|
||||
{
|
||||
get
|
||||
{
|
||||
return _centerTextOffset
|
||||
}
|
||||
set
|
||||
{
|
||||
_centerTextOffset = newValue
|
||||
setNeedsDisplay()
|
||||
}
|
||||
}
|
||||
|
||||
/// `true` if drawing the center text is enabled
|
||||
@objc open var drawCenterTextEnabled: Bool
|
||||
{
|
||||
get
|
||||
{
|
||||
return _drawCenterTextEnabled
|
||||
}
|
||||
set
|
||||
{
|
||||
_drawCenterTextEnabled = newValue
|
||||
setNeedsDisplay()
|
||||
}
|
||||
}
|
||||
|
||||
/// - returns: `true` if drawing the center text is enabled
|
||||
@objc open var isDrawCenterTextEnabled: Bool
|
||||
{
|
||||
get
|
||||
{
|
||||
return drawCenterTextEnabled
|
||||
}
|
||||
}
|
||||
|
||||
internal override var requiredLegendOffset: CGFloat
|
||||
{
|
||||
return _legend.font.pointSize * 2.0
|
||||
}
|
||||
|
||||
internal override var requiredBaseOffset: CGFloat
|
||||
{
|
||||
return 0.0
|
||||
}
|
||||
|
||||
open override var radius: CGFloat
|
||||
{
|
||||
return _circleBox.width / 2.0
|
||||
}
|
||||
|
||||
/// - returns: The circlebox, the boundingbox of the pie-chart slices
|
||||
@objc open var circleBox: CGRect
|
||||
{
|
||||
return _circleBox
|
||||
}
|
||||
|
||||
/// - returns: The center of the circlebox
|
||||
@objc open var centerCircleBox: CGPoint
|
||||
{
|
||||
return CGPoint(x: _circleBox.midX, y: _circleBox.midY)
|
||||
}
|
||||
|
||||
/// the radius of the hole in the center of the piechart in percent of the maximum radius (max = the radius of the whole chart)
|
||||
///
|
||||
/// **default**: 0.5 (50%) (half the pie)
|
||||
@objc open var holeRadiusPercent: CGFloat
|
||||
{
|
||||
get
|
||||
{
|
||||
return _holeRadiusPercent
|
||||
}
|
||||
set
|
||||
{
|
||||
_holeRadiusPercent = newValue
|
||||
setNeedsDisplay()
|
||||
}
|
||||
}
|
||||
|
||||
/// The color that the transparent-circle should have.
|
||||
///
|
||||
/// **default**: `nil`
|
||||
@objc open var transparentCircleColor: NSUIColor?
|
||||
{
|
||||
get
|
||||
{
|
||||
return _transparentCircleColor
|
||||
}
|
||||
set
|
||||
{
|
||||
_transparentCircleColor = newValue
|
||||
setNeedsDisplay()
|
||||
}
|
||||
}
|
||||
|
||||
/// the radius of the transparent circle that is drawn next to the hole in the piechart in percent of the maximum radius (max = the radius of the whole chart)
|
||||
///
|
||||
/// **default**: 0.55 (55%) -> means 5% larger than the center-hole by default
|
||||
@objc open var transparentCircleRadiusPercent: CGFloat
|
||||
{
|
||||
get
|
||||
{
|
||||
return _transparentCircleRadiusPercent
|
||||
}
|
||||
set
|
||||
{
|
||||
_transparentCircleRadiusPercent = newValue
|
||||
setNeedsDisplay()
|
||||
}
|
||||
}
|
||||
|
||||
/// The color the entry labels are drawn with.
|
||||
@objc open var entryLabelColor: NSUIColor?
|
||||
{
|
||||
get { return _entryLabelColor }
|
||||
set
|
||||
{
|
||||
_entryLabelColor = newValue
|
||||
setNeedsDisplay()
|
||||
}
|
||||
}
|
||||
|
||||
/// The font the entry labels are drawn with.
|
||||
@objc open var entryLabelFont: NSUIFont?
|
||||
{
|
||||
get { return _entryLabelFont }
|
||||
set
|
||||
{
|
||||
_entryLabelFont = newValue
|
||||
setNeedsDisplay()
|
||||
}
|
||||
}
|
||||
|
||||
/// Set this to true to draw the enrty labels into the pie slices
|
||||
@objc open var drawEntryLabelsEnabled: Bool
|
||||
{
|
||||
get
|
||||
{
|
||||
return _drawEntryLabelsEnabled
|
||||
}
|
||||
set
|
||||
{
|
||||
_drawEntryLabelsEnabled = newValue
|
||||
setNeedsDisplay()
|
||||
}
|
||||
}
|
||||
|
||||
/// - returns: `true` if drawing entry labels is enabled, `false` ifnot
|
||||
@objc open var isDrawEntryLabelsEnabled: Bool
|
||||
{
|
||||
get
|
||||
{
|
||||
return drawEntryLabelsEnabled
|
||||
}
|
||||
}
|
||||
|
||||
/// If this is enabled, values inside the PieChart are drawn in percent and not with their original value. Values provided for the ValueFormatter to format are then provided in percent.
|
||||
@objc open var usePercentValuesEnabled: Bool
|
||||
{
|
||||
get
|
||||
{
|
||||
return _usePercentValuesEnabled
|
||||
}
|
||||
set
|
||||
{
|
||||
_usePercentValuesEnabled = newValue
|
||||
setNeedsDisplay()
|
||||
}
|
||||
}
|
||||
|
||||
/// - returns: `true` if drawing x-values is enabled, `false` ifnot
|
||||
@objc open var isUsePercentValuesEnabled: Bool
|
||||
{
|
||||
get
|
||||
{
|
||||
return usePercentValuesEnabled
|
||||
}
|
||||
}
|
||||
|
||||
/// the rectangular radius of the bounding box for the center text, as a percentage of the pie hole
|
||||
@objc open var centerTextRadiusPercent: CGFloat
|
||||
{
|
||||
get
|
||||
{
|
||||
return _centerTextRadiusPercent
|
||||
}
|
||||
set
|
||||
{
|
||||
_centerTextRadiusPercent = newValue
|
||||
setNeedsDisplay()
|
||||
}
|
||||
}
|
||||
|
||||
/// The max angle that is used for calculating the pie-circle.
|
||||
/// 360 means it's a full pie-chart, 180 results in a half-pie-chart.
|
||||
/// **default**: 360.0
|
||||
@objc open var maxAngle: CGFloat
|
||||
{
|
||||
get
|
||||
{
|
||||
return _maxAngle
|
||||
}
|
||||
set
|
||||
{
|
||||
_maxAngle = newValue
|
||||
|
||||
if _maxAngle > 360.0
|
||||
{
|
||||
_maxAngle = 360.0
|
||||
}
|
||||
|
||||
if _maxAngle < 90.0
|
||||
{
|
||||
_maxAngle = 90.0
|
||||
}
|
||||
}
|
||||
}
|
||||
}
|
||||
866
Pods/Charts/Source/Charts/Charts/PieRadarChartViewBase.swift
generated
Executable file
866
Pods/Charts/Source/Charts/Charts/PieRadarChartViewBase.swift
generated
Executable file
@@ -0,0 +1,866 @@
|
||||
//
|
||||
// PieRadarChartViewBase.swift
|
||||
// Charts
|
||||
//
|
||||
// Copyright 2015 Daniel Cohen Gindi & Philipp Jahoda
|
||||
// A port of MPAndroidChart for iOS
|
||||
// Licensed under Apache License 2.0
|
||||
//
|
||||
// https://github.com/danielgindi/Charts
|
||||
//
|
||||
|
||||
import Foundation
|
||||
import CoreGraphics
|
||||
|
||||
#if !os(OSX)
|
||||
import UIKit
|
||||
#endif
|
||||
|
||||
/// Base class of PieChartView and RadarChartView.
|
||||
open class PieRadarChartViewBase: ChartViewBase
|
||||
{
|
||||
/// holds the normalized version of the current rotation angle of the chart
|
||||
private var _rotationAngle = CGFloat(270.0)
|
||||
|
||||
/// holds the raw version of the current rotation angle of the chart
|
||||
private var _rawRotationAngle = CGFloat(270.0)
|
||||
|
||||
/// flag that indicates if rotation is enabled or not
|
||||
@objc open var rotationEnabled = true
|
||||
|
||||
/// Sets the minimum offset (padding) around the chart, defaults to 0.0
|
||||
@objc open var minOffset = CGFloat(0.0)
|
||||
|
||||
/// iOS && OSX only: Enabled multi-touch rotation using two fingers.
|
||||
private var _rotationWithTwoFingers = false
|
||||
|
||||
private var _tapGestureRecognizer: NSUITapGestureRecognizer!
|
||||
#if !os(tvOS)
|
||||
private var _rotationGestureRecognizer: NSUIRotationGestureRecognizer!
|
||||
#endif
|
||||
|
||||
public override init(frame: CGRect)
|
||||
{
|
||||
super.init(frame: frame)
|
||||
}
|
||||
|
||||
public required init?(coder aDecoder: NSCoder)
|
||||
{
|
||||
super.init(coder: aDecoder)
|
||||
}
|
||||
|
||||
deinit
|
||||
{
|
||||
stopDeceleration()
|
||||
}
|
||||
|
||||
internal override func initialize()
|
||||
{
|
||||
super.initialize()
|
||||
|
||||
_tapGestureRecognizer = NSUITapGestureRecognizer(target: self, action: #selector(tapGestureRecognized(_:)))
|
||||
|
||||
self.addGestureRecognizer(_tapGestureRecognizer)
|
||||
|
||||
#if !os(tvOS)
|
||||
_rotationGestureRecognizer = NSUIRotationGestureRecognizer(target: self, action: #selector(rotationGestureRecognized(_:)))
|
||||
self.addGestureRecognizer(_rotationGestureRecognizer)
|
||||
_rotationGestureRecognizer.isEnabled = rotationWithTwoFingers
|
||||
#endif
|
||||
}
|
||||
|
||||
internal override func calcMinMax()
|
||||
{
|
||||
/*_xAxis.axisRange = Double((_data?.xVals.count ?? 0) - 1)*/
|
||||
}
|
||||
|
||||
open override var maxVisibleCount: Int
|
||||
{
|
||||
get
|
||||
{
|
||||
return data?.entryCount ?? 0
|
||||
}
|
||||
}
|
||||
|
||||
open override func notifyDataSetChanged()
|
||||
{
|
||||
calcMinMax()
|
||||
|
||||
if let data = _data , _legend !== nil
|
||||
{
|
||||
legendRenderer.computeLegend(data: data)
|
||||
}
|
||||
|
||||
calculateOffsets()
|
||||
|
||||
setNeedsDisplay()
|
||||
}
|
||||
|
||||
internal override func calculateOffsets()
|
||||
{
|
||||
var legendLeft = CGFloat(0.0)
|
||||
var legendRight = CGFloat(0.0)
|
||||
var legendBottom = CGFloat(0.0)
|
||||
var legendTop = CGFloat(0.0)
|
||||
|
||||
if _legend != nil && _legend.enabled && !_legend.drawInside
|
||||
{
|
||||
let fullLegendWidth = min(_legend.neededWidth, _viewPortHandler.chartWidth * _legend.maxSizePercent)
|
||||
|
||||
switch _legend.orientation
|
||||
{
|
||||
case .vertical:
|
||||
|
||||
var xLegendOffset: CGFloat = 0.0
|
||||
|
||||
if _legend.horizontalAlignment == .left
|
||||
|| _legend.horizontalAlignment == .right
|
||||
{
|
||||
if _legend.verticalAlignment == .center
|
||||
{
|
||||
// this is the space between the legend and the chart
|
||||
let spacing = CGFloat(13.0)
|
||||
|
||||
xLegendOffset = fullLegendWidth + spacing
|
||||
}
|
||||
else
|
||||
{
|
||||
// this is the space between the legend and the chart
|
||||
let spacing = CGFloat(8.0)
|
||||
|
||||
let legendWidth = fullLegendWidth + spacing
|
||||
let legendHeight = _legend.neededHeight + _legend.textHeightMax
|
||||
|
||||
let c = self.midPoint
|
||||
|
||||
let bottomX = _legend.horizontalAlignment == .right
|
||||
? self.bounds.width - legendWidth + 15.0
|
||||
: legendWidth - 15.0
|
||||
let bottomY = legendHeight + 15
|
||||
let distLegend = distanceToCenter(x: bottomX, y: bottomY)
|
||||
|
||||
let reference = getPosition(center: c, dist: self.radius,
|
||||
angle: angleForPoint(x: bottomX, y: bottomY))
|
||||
|
||||
let distReference = distanceToCenter(x: reference.x, y: reference.y)
|
||||
let minOffset = CGFloat(5.0)
|
||||
|
||||
if bottomY >= c.y
|
||||
&& self.bounds.height - legendWidth > self.bounds.width
|
||||
{
|
||||
xLegendOffset = legendWidth
|
||||
}
|
||||
else if distLegend < distReference
|
||||
{
|
||||
let diff = distReference - distLegend
|
||||
xLegendOffset = minOffset + diff
|
||||
}
|
||||
}
|
||||
}
|
||||
|
||||
switch _legend.horizontalAlignment
|
||||
{
|
||||
case .left:
|
||||
legendLeft = xLegendOffset
|
||||
|
||||
case .right:
|
||||
legendRight = xLegendOffset
|
||||
|
||||
case .center:
|
||||
|
||||
switch _legend.verticalAlignment
|
||||
{
|
||||
case .top:
|
||||
legendTop = min(_legend.neededHeight, _viewPortHandler.chartHeight * _legend.maxSizePercent)
|
||||
|
||||
case .bottom:
|
||||
legendBottom = min(_legend.neededHeight, _viewPortHandler.chartHeight * _legend.maxSizePercent)
|
||||
|
||||
default:
|
||||
break
|
||||
}
|
||||
}
|
||||
|
||||
case .horizontal:
|
||||
|
||||
var yLegendOffset: CGFloat = 0.0
|
||||
|
||||
if _legend.verticalAlignment == .top
|
||||
|| _legend.verticalAlignment == .bottom
|
||||
{
|
||||
// It's possible that we do not need this offset anymore as it
|
||||
// is available through the extraOffsets, but changing it can mean
|
||||
// changing default visibility for existing apps.
|
||||
let yOffset = self.requiredLegendOffset
|
||||
|
||||
yLegendOffset = min(
|
||||
_legend.neededHeight + yOffset,
|
||||
_viewPortHandler.chartHeight * _legend.maxSizePercent)
|
||||
}
|
||||
|
||||
switch _legend.verticalAlignment
|
||||
{
|
||||
case .top:
|
||||
|
||||
legendTop = yLegendOffset
|
||||
|
||||
case .bottom:
|
||||
|
||||
legendBottom = yLegendOffset
|
||||
|
||||
default:
|
||||
break
|
||||
}
|
||||
}
|
||||
|
||||
legendLeft += self.requiredBaseOffset
|
||||
legendRight += self.requiredBaseOffset
|
||||
legendTop += self.requiredBaseOffset
|
||||
legendBottom += self.requiredBaseOffset
|
||||
}
|
||||
|
||||
legendTop += self.extraTopOffset
|
||||
legendRight += self.extraRightOffset
|
||||
legendBottom += self.extraBottomOffset
|
||||
legendLeft += self.extraLeftOffset
|
||||
|
||||
var minOffset = self.minOffset
|
||||
|
||||
if self is RadarChartView
|
||||
{
|
||||
let x = self.xAxis
|
||||
|
||||
if x.isEnabled && x.drawLabelsEnabled
|
||||
{
|
||||
minOffset = max(minOffset, x.labelRotatedWidth)
|
||||
}
|
||||
}
|
||||
|
||||
let offsetLeft = max(minOffset, legendLeft)
|
||||
let offsetTop = max(minOffset, legendTop)
|
||||
let offsetRight = max(minOffset, legendRight)
|
||||
let offsetBottom = max(minOffset, max(self.requiredBaseOffset, legendBottom))
|
||||
|
||||
_viewPortHandler.restrainViewPort(offsetLeft: offsetLeft, offsetTop: offsetTop, offsetRight: offsetRight, offsetBottom: offsetBottom)
|
||||
}
|
||||
|
||||
/// - returns: The angle relative to the chart center for the given point on the chart in degrees.
|
||||
/// The angle is always between 0 and 360°, 0° is NORTH, 90° is EAST, ...
|
||||
@objc open func angleForPoint(x: CGFloat, y: CGFloat) -> CGFloat
|
||||
{
|
||||
let c = centerOffsets
|
||||
|
||||
let tx = Double(x - c.x)
|
||||
let ty = Double(y - c.y)
|
||||
let length = sqrt(tx * tx + ty * ty)
|
||||
let r = acos(ty / length)
|
||||
|
||||
var angle = r.RAD2DEG
|
||||
|
||||
if x > c.x
|
||||
{
|
||||
angle = 360.0 - angle
|
||||
}
|
||||
|
||||
// add 90° because chart starts EAST
|
||||
angle = angle + 90.0
|
||||
|
||||
// neutralize overflow
|
||||
if angle > 360.0
|
||||
{
|
||||
angle = angle - 360.0
|
||||
}
|
||||
|
||||
return CGFloat(angle)
|
||||
}
|
||||
|
||||
/// Calculates the position around a center point, depending on the distance
|
||||
/// from the center, and the angle of the position around the center.
|
||||
@objc open func getPosition(center: CGPoint, dist: CGFloat, angle: CGFloat) -> CGPoint
|
||||
{
|
||||
return CGPoint(x: center.x + dist * cos(angle.DEG2RAD),
|
||||
y: center.y + dist * sin(angle.DEG2RAD))
|
||||
}
|
||||
|
||||
/// - returns: The distance of a certain point on the chart to the center of the chart.
|
||||
@objc open func distanceToCenter(x: CGFloat, y: CGFloat) -> CGFloat
|
||||
{
|
||||
let c = self.centerOffsets
|
||||
|
||||
var dist = CGFloat(0.0)
|
||||
|
||||
var xDist = CGFloat(0.0)
|
||||
var yDist = CGFloat(0.0)
|
||||
|
||||
if x > c.x
|
||||
{
|
||||
xDist = x - c.x
|
||||
}
|
||||
else
|
||||
{
|
||||
xDist = c.x - x
|
||||
}
|
||||
|
||||
if y > c.y
|
||||
{
|
||||
yDist = y - c.y
|
||||
}
|
||||
else
|
||||
{
|
||||
yDist = c.y - y
|
||||
}
|
||||
|
||||
// pythagoras
|
||||
dist = sqrt(pow(xDist, 2.0) + pow(yDist, 2.0))
|
||||
|
||||
return dist
|
||||
}
|
||||
|
||||
/// - returns: The xIndex for the given angle around the center of the chart.
|
||||
/// -1 if not found / outofbounds.
|
||||
@objc open func indexForAngle(_ angle: CGFloat) -> Int
|
||||
{
|
||||
fatalError("indexForAngle() cannot be called on PieRadarChartViewBase")
|
||||
}
|
||||
|
||||
/// current rotation angle of the pie chart
|
||||
///
|
||||
/// **default**: 270 --> top (NORTH)
|
||||
/// - returns: Will always return a normalized value, which will be between 0.0 < 360.0
|
||||
@objc open var rotationAngle: CGFloat
|
||||
{
|
||||
get
|
||||
{
|
||||
return _rotationAngle
|
||||
}
|
||||
set
|
||||
{
|
||||
_rawRotationAngle = newValue
|
||||
_rotationAngle = newValue.normalizedAngle
|
||||
setNeedsDisplay()
|
||||
}
|
||||
}
|
||||
|
||||
/// gets the raw version of the current rotation angle of the pie chart the returned value could be any value, negative or positive, outside of the 360 degrees.
|
||||
/// this is used when working with rotation direction, mainly by gestures and animations.
|
||||
@objc open var rawRotationAngle: CGFloat
|
||||
{
|
||||
return _rawRotationAngle
|
||||
}
|
||||
|
||||
/// - returns: The diameter of the pie- or radar-chart
|
||||
@objc open var diameter: CGFloat
|
||||
{
|
||||
var content = _viewPortHandler.contentRect
|
||||
content.origin.x += extraLeftOffset
|
||||
content.origin.y += extraTopOffset
|
||||
content.size.width -= extraLeftOffset + extraRightOffset
|
||||
content.size.height -= extraTopOffset + extraBottomOffset
|
||||
return min(content.width, content.height)
|
||||
}
|
||||
|
||||
/// - returns: The radius of the chart in pixels.
|
||||
@objc open var radius: CGFloat
|
||||
{
|
||||
fatalError("radius cannot be called on PieRadarChartViewBase")
|
||||
}
|
||||
|
||||
/// - returns: The required offset for the chart legend.
|
||||
internal var requiredLegendOffset: CGFloat
|
||||
{
|
||||
fatalError("requiredLegendOffset cannot be called on PieRadarChartViewBase")
|
||||
}
|
||||
|
||||
/// - returns: The base offset needed for the chart without calculating the
|
||||
/// legend size.
|
||||
internal var requiredBaseOffset: CGFloat
|
||||
{
|
||||
fatalError("requiredBaseOffset cannot be called on PieRadarChartViewBase")
|
||||
}
|
||||
|
||||
open override var chartYMax: Double
|
||||
{
|
||||
return 0.0
|
||||
}
|
||||
|
||||
open override var chartYMin: Double
|
||||
{
|
||||
return 0.0
|
||||
}
|
||||
|
||||
@objc open var isRotationEnabled: Bool { return rotationEnabled }
|
||||
|
||||
/// flag that indicates if rotation is done with two fingers or one.
|
||||
/// when the chart is inside a scrollview, you need a two-finger rotation because a one-finger rotation eats up all touch events.
|
||||
///
|
||||
/// On iOS this will disable one-finger rotation.
|
||||
/// On OSX this will keep two-finger multitouch rotation, and one-pointer mouse rotation.
|
||||
///
|
||||
/// **default**: false
|
||||
@objc open var rotationWithTwoFingers: Bool
|
||||
{
|
||||
get
|
||||
{
|
||||
return _rotationWithTwoFingers
|
||||
}
|
||||
set
|
||||
{
|
||||
_rotationWithTwoFingers = newValue
|
||||
#if !os(tvOS)
|
||||
_rotationGestureRecognizer.isEnabled = _rotationWithTwoFingers
|
||||
#endif
|
||||
}
|
||||
}
|
||||
|
||||
/// flag that indicates if rotation is done with two fingers or one.
|
||||
/// when the chart is inside a scrollview, you need a two-finger rotation because a one-finger rotation eats up all touch events.
|
||||
///
|
||||
/// On iOS this will disable one-finger rotation.
|
||||
/// On OSX this will keep two-finger multitouch rotation, and one-pointer mouse rotation.
|
||||
///
|
||||
/// **default**: false
|
||||
@objc open var isRotationWithTwoFingers: Bool
|
||||
{
|
||||
return _rotationWithTwoFingers
|
||||
}
|
||||
|
||||
// MARK: - Animation
|
||||
|
||||
private var _spinAnimator: Animator!
|
||||
|
||||
/// Applys a spin animation to the Chart.
|
||||
@objc open func spin(duration: TimeInterval, fromAngle: CGFloat, toAngle: CGFloat, easing: ChartEasingFunctionBlock?)
|
||||
{
|
||||
if _spinAnimator != nil
|
||||
{
|
||||
_spinAnimator.stop()
|
||||
}
|
||||
|
||||
_spinAnimator = Animator()
|
||||
_spinAnimator.updateBlock = {
|
||||
self.rotationAngle = (toAngle - fromAngle) * CGFloat(self._spinAnimator.phaseX) + fromAngle
|
||||
}
|
||||
_spinAnimator.stopBlock = { self._spinAnimator = nil }
|
||||
|
||||
_spinAnimator.animate(xAxisDuration: duration, easing: easing)
|
||||
}
|
||||
|
||||
@objc open func spin(duration: TimeInterval, fromAngle: CGFloat, toAngle: CGFloat, easingOption: ChartEasingOption)
|
||||
{
|
||||
spin(duration: duration, fromAngle: fromAngle, toAngle: toAngle, easing: easingFunctionFromOption(easingOption))
|
||||
}
|
||||
|
||||
@objc open func spin(duration: TimeInterval, fromAngle: CGFloat, toAngle: CGFloat)
|
||||
{
|
||||
spin(duration: duration, fromAngle: fromAngle, toAngle: toAngle, easing: nil)
|
||||
}
|
||||
|
||||
@objc open func stopSpinAnimation()
|
||||
{
|
||||
if _spinAnimator != nil
|
||||
{
|
||||
_spinAnimator.stop()
|
||||
}
|
||||
}
|
||||
|
||||
// MARK: - Gestures
|
||||
|
||||
private var _rotationGestureStartPoint: CGPoint!
|
||||
private var _isRotating = false
|
||||
private var _startAngle = CGFloat(0.0)
|
||||
|
||||
private struct AngularVelocitySample
|
||||
{
|
||||
var time: TimeInterval
|
||||
var angle: CGFloat
|
||||
}
|
||||
|
||||
private var _velocitySamples = [AngularVelocitySample]()
|
||||
|
||||
private var _decelerationLastTime: TimeInterval = 0.0
|
||||
private var _decelerationDisplayLink: NSUIDisplayLink!
|
||||
private var _decelerationAngularVelocity: CGFloat = 0.0
|
||||
|
||||
internal final func processRotationGestureBegan(location: CGPoint)
|
||||
{
|
||||
self.resetVelocity()
|
||||
|
||||
if rotationEnabled
|
||||
{
|
||||
self.sampleVelocity(touchLocation: location)
|
||||
}
|
||||
|
||||
self.setGestureStartAngle(x: location.x, y: location.y)
|
||||
|
||||
_rotationGestureStartPoint = location
|
||||
}
|
||||
|
||||
internal final func processRotationGestureMoved(location: CGPoint)
|
||||
{
|
||||
if isDragDecelerationEnabled
|
||||
{
|
||||
sampleVelocity(touchLocation: location)
|
||||
}
|
||||
|
||||
if !_isRotating &&
|
||||
distance(
|
||||
eventX: location.x,
|
||||
startX: _rotationGestureStartPoint.x,
|
||||
eventY: location.y,
|
||||
startY: _rotationGestureStartPoint.y) > CGFloat(8.0)
|
||||
{
|
||||
_isRotating = true
|
||||
}
|
||||
else
|
||||
{
|
||||
self.updateGestureRotation(x: location.x, y: location.y)
|
||||
setNeedsDisplay()
|
||||
}
|
||||
}
|
||||
|
||||
internal final func processRotationGestureEnded(location: CGPoint)
|
||||
{
|
||||
if isDragDecelerationEnabled
|
||||
{
|
||||
stopDeceleration()
|
||||
|
||||
sampleVelocity(touchLocation: location)
|
||||
|
||||
_decelerationAngularVelocity = calculateVelocity()
|
||||
|
||||
if _decelerationAngularVelocity != 0.0
|
||||
{
|
||||
_decelerationLastTime = CACurrentMediaTime()
|
||||
_decelerationDisplayLink = NSUIDisplayLink(target: self, selector: #selector(PieRadarChartViewBase.decelerationLoop))
|
||||
_decelerationDisplayLink.add(to: RunLoop.main, forMode: RunLoopMode.commonModes)
|
||||
}
|
||||
}
|
||||
}
|
||||
|
||||
internal final func processRotationGestureCancelled()
|
||||
{
|
||||
if _isRotating
|
||||
{
|
||||
_isRotating = false
|
||||
}
|
||||
}
|
||||
|
||||
#if !os(OSX)
|
||||
open override func nsuiTouchesBegan(_ touches: Set<NSUITouch>, withEvent event: NSUIEvent?)
|
||||
{
|
||||
// if rotation by touch is enabled
|
||||
if rotationEnabled
|
||||
{
|
||||
stopDeceleration()
|
||||
|
||||
if !rotationWithTwoFingers, let touchLocation = touches.first?.location(in: self)
|
||||
{
|
||||
processRotationGestureBegan(location: touchLocation)
|
||||
}
|
||||
}
|
||||
|
||||
if !_isRotating
|
||||
{
|
||||
super.nsuiTouchesBegan(touches, withEvent: event)
|
||||
}
|
||||
}
|
||||
|
||||
open override func nsuiTouchesMoved(_ touches: Set<NSUITouch>, withEvent event: NSUIEvent?)
|
||||
{
|
||||
if rotationEnabled && !rotationWithTwoFingers, let touch = touches.first
|
||||
{
|
||||
let touchLocation = touch.location(in: self)
|
||||
processRotationGestureMoved(location: touchLocation)
|
||||
}
|
||||
|
||||
if !_isRotating
|
||||
{
|
||||
super.nsuiTouchesMoved(touches, withEvent: event)
|
||||
}
|
||||
}
|
||||
|
||||
open override func nsuiTouchesEnded(_ touches: Set<NSUITouch>, withEvent event: NSUIEvent?)
|
||||
{
|
||||
if !_isRotating
|
||||
{
|
||||
super.nsuiTouchesEnded(touches, withEvent: event)
|
||||
}
|
||||
|
||||
if rotationEnabled && !rotationWithTwoFingers, let touch = touches.first
|
||||
{
|
||||
let touchLocation = touch.location(in: self)
|
||||
processRotationGestureEnded(location: touchLocation)
|
||||
}
|
||||
|
||||
if _isRotating
|
||||
{
|
||||
_isRotating = false
|
||||
}
|
||||
}
|
||||
|
||||
open override func nsuiTouchesCancelled(_ touches: Set<NSUITouch>?, withEvent event: NSUIEvent?)
|
||||
{
|
||||
super.nsuiTouchesCancelled(touches, withEvent: event)
|
||||
|
||||
processRotationGestureCancelled()
|
||||
}
|
||||
#endif
|
||||
|
||||
#if os(OSX)
|
||||
open override func mouseDown(with theEvent: NSEvent)
|
||||
{
|
||||
// if rotation by touch is enabled
|
||||
if rotationEnabled
|
||||
{
|
||||
stopDeceleration()
|
||||
|
||||
let location = self.convert(theEvent.locationInWindow, from: nil)
|
||||
|
||||
processRotationGestureBegan(location: location)
|
||||
}
|
||||
|
||||
if !_isRotating
|
||||
{
|
||||
super.mouseDown(with: theEvent)
|
||||
}
|
||||
}
|
||||
|
||||
open override func mouseDragged(with theEvent: NSEvent)
|
||||
{
|
||||
if rotationEnabled
|
||||
{
|
||||
let location = self.convert(theEvent.locationInWindow, from: nil)
|
||||
|
||||
processRotationGestureMoved(location: location)
|
||||
}
|
||||
|
||||
if !_isRotating
|
||||
{
|
||||
super.mouseDragged(with: theEvent)
|
||||
}
|
||||
}
|
||||
|
||||
open override func mouseUp(with theEvent: NSEvent)
|
||||
{
|
||||
if !_isRotating
|
||||
{
|
||||
super.mouseUp(with: theEvent)
|
||||
}
|
||||
|
||||
if rotationEnabled
|
||||
{
|
||||
let location = self.convert(theEvent.locationInWindow, from: nil)
|
||||
|
||||
processRotationGestureEnded(location: location)
|
||||
}
|
||||
|
||||
if _isRotating
|
||||
{
|
||||
_isRotating = false
|
||||
}
|
||||
}
|
||||
#endif
|
||||
|
||||
private func resetVelocity()
|
||||
{
|
||||
_velocitySamples.removeAll(keepingCapacity: false)
|
||||
}
|
||||
|
||||
private func sampleVelocity(touchLocation: CGPoint)
|
||||
{
|
||||
let currentTime = CACurrentMediaTime()
|
||||
|
||||
_velocitySamples.append(AngularVelocitySample(time: currentTime, angle: angleForPoint(x: touchLocation.x, y: touchLocation.y)))
|
||||
|
||||
// Remove samples older than our sample time - 1 seconds
|
||||
var i = 0, count = _velocitySamples.count
|
||||
while (i < count - 2)
|
||||
{
|
||||
if currentTime - _velocitySamples[i].time > 1.0
|
||||
{
|
||||
_velocitySamples.remove(at: 0)
|
||||
i -= 1
|
||||
count -= 1
|
||||
}
|
||||
else
|
||||
{
|
||||
break
|
||||
}
|
||||
|
||||
i += 1
|
||||
}
|
||||
}
|
||||
|
||||
private func calculateVelocity() -> CGFloat
|
||||
{
|
||||
if _velocitySamples.isEmpty
|
||||
{
|
||||
return 0.0
|
||||
}
|
||||
|
||||
var firstSample = _velocitySamples[0]
|
||||
var lastSample = _velocitySamples[_velocitySamples.count - 1]
|
||||
|
||||
// Look for a sample that's closest to the latest sample, but not the same, so we can deduce the direction
|
||||
var beforeLastSample = firstSample
|
||||
for i in stride(from: (_velocitySamples.count - 1), through: 0, by: -1)
|
||||
{
|
||||
beforeLastSample = _velocitySamples[i]
|
||||
if beforeLastSample.angle != lastSample.angle
|
||||
{
|
||||
break
|
||||
}
|
||||
}
|
||||
|
||||
// Calculate the sampling time
|
||||
var timeDelta = lastSample.time - firstSample.time
|
||||
if timeDelta == 0.0
|
||||
{
|
||||
timeDelta = 0.1
|
||||
}
|
||||
|
||||
// Calculate clockwise/ccw by choosing two values that should be closest to each other,
|
||||
// so if the angles are two far from each other we know they are inverted "for sure"
|
||||
var clockwise = lastSample.angle >= beforeLastSample.angle
|
||||
if (abs(lastSample.angle - beforeLastSample.angle) > 270.0)
|
||||
{
|
||||
clockwise = !clockwise
|
||||
}
|
||||
|
||||
// Now if the "gesture" is over a too big of an angle - then we know the angles are inverted, and we need to move them closer to each other from both sides of the 360.0 wrapping point
|
||||
if lastSample.angle - firstSample.angle > 180.0
|
||||
{
|
||||
firstSample.angle += 360.0
|
||||
}
|
||||
else if firstSample.angle - lastSample.angle > 180.0
|
||||
{
|
||||
lastSample.angle += 360.0
|
||||
}
|
||||
|
||||
// The velocity
|
||||
var velocity = abs((lastSample.angle - firstSample.angle) / CGFloat(timeDelta))
|
||||
|
||||
// Direction?
|
||||
if !clockwise
|
||||
{
|
||||
velocity = -velocity
|
||||
}
|
||||
|
||||
return velocity
|
||||
}
|
||||
|
||||
/// sets the starting angle of the rotation, this is only used by the touch listener, x and y is the touch position
|
||||
private func setGestureStartAngle(x: CGFloat, y: CGFloat)
|
||||
{
|
||||
_startAngle = angleForPoint(x: x, y: y)
|
||||
|
||||
// take the current angle into consideration when starting a new drag
|
||||
_startAngle -= _rotationAngle
|
||||
}
|
||||
|
||||
/// updates the view rotation depending on the given touch position, also takes the starting angle into consideration
|
||||
private func updateGestureRotation(x: CGFloat, y: CGFloat)
|
||||
{
|
||||
self.rotationAngle = angleForPoint(x: x, y: y) - _startAngle
|
||||
}
|
||||
|
||||
@objc open func stopDeceleration()
|
||||
{
|
||||
if _decelerationDisplayLink !== nil
|
||||
{
|
||||
_decelerationDisplayLink.remove(from: RunLoop.main, forMode: RunLoopMode.commonModes)
|
||||
_decelerationDisplayLink = nil
|
||||
}
|
||||
}
|
||||
|
||||
@objc private func decelerationLoop()
|
||||
{
|
||||
let currentTime = CACurrentMediaTime()
|
||||
|
||||
_decelerationAngularVelocity *= self.dragDecelerationFrictionCoef
|
||||
|
||||
let timeInterval = CGFloat(currentTime - _decelerationLastTime)
|
||||
|
||||
self.rotationAngle += _decelerationAngularVelocity * timeInterval
|
||||
|
||||
_decelerationLastTime = currentTime
|
||||
|
||||
if(abs(_decelerationAngularVelocity) < 0.001)
|
||||
{
|
||||
stopDeceleration()
|
||||
}
|
||||
}
|
||||
|
||||
/// - returns: The distance between two points
|
||||
private func distance(eventX: CGFloat, startX: CGFloat, eventY: CGFloat, startY: CGFloat) -> CGFloat
|
||||
{
|
||||
let dx = eventX - startX
|
||||
let dy = eventY - startY
|
||||
return sqrt(dx * dx + dy * dy)
|
||||
}
|
||||
|
||||
/// - returns: The distance between two points
|
||||
private func distance(from: CGPoint, to: CGPoint) -> CGFloat
|
||||
{
|
||||
let dx = from.x - to.x
|
||||
let dy = from.y - to.y
|
||||
return sqrt(dx * dx + dy * dy)
|
||||
}
|
||||
|
||||
/// reference to the last highlighted object
|
||||
private var _lastHighlight: Highlight!
|
||||
|
||||
@objc private func tapGestureRecognized(_ recognizer: NSUITapGestureRecognizer)
|
||||
{
|
||||
if recognizer.state == NSUIGestureRecognizerState.ended
|
||||
{
|
||||
if !self.isHighLightPerTapEnabled { return }
|
||||
|
||||
let location = recognizer.location(in: self)
|
||||
|
||||
let high = self.getHighlightByTouchPoint(location)
|
||||
self.highlightValue(high, callDelegate: true)
|
||||
}
|
||||
}
|
||||
|
||||
#if !os(tvOS)
|
||||
@objc private func rotationGestureRecognized(_ recognizer: NSUIRotationGestureRecognizer)
|
||||
{
|
||||
if recognizer.state == NSUIGestureRecognizerState.began
|
||||
{
|
||||
stopDeceleration()
|
||||
|
||||
_startAngle = self.rawRotationAngle
|
||||
}
|
||||
|
||||
if recognizer.state == NSUIGestureRecognizerState.began || recognizer.state == NSUIGestureRecognizerState.changed
|
||||
{
|
||||
let angle = recognizer.nsuiRotation.RAD2DEG
|
||||
|
||||
self.rotationAngle = _startAngle + angle
|
||||
setNeedsDisplay()
|
||||
}
|
||||
else if recognizer.state == NSUIGestureRecognizerState.ended
|
||||
{
|
||||
let angle = recognizer.nsuiRotation.RAD2DEG
|
||||
|
||||
self.rotationAngle = _startAngle + angle
|
||||
setNeedsDisplay()
|
||||
|
||||
if isDragDecelerationEnabled
|
||||
{
|
||||
stopDeceleration()
|
||||
|
||||
_decelerationAngularVelocity = recognizer.velocity.RAD2DEG
|
||||
|
||||
if _decelerationAngularVelocity != 0.0
|
||||
{
|
||||
_decelerationLastTime = CACurrentMediaTime()
|
||||
_decelerationDisplayLink = NSUIDisplayLink(target: self, selector: #selector(PieRadarChartViewBase.decelerationLoop))
|
||||
_decelerationDisplayLink.add(to: RunLoop.main, forMode: RunLoopMode.commonModes)
|
||||
}
|
||||
}
|
||||
}
|
||||
}
|
||||
#endif
|
||||
}
|
||||
232
Pods/Charts/Source/Charts/Charts/RadarChartView.swift
generated
Normal file
232
Pods/Charts/Source/Charts/Charts/RadarChartView.swift
generated
Normal file
@@ -0,0 +1,232 @@
|
||||
//
|
||||
// RadarChartView.swift
|
||||
// Charts
|
||||
//
|
||||
// Copyright 2015 Daniel Cohen Gindi & Philipp Jahoda
|
||||
// A port of MPAndroidChart for iOS
|
||||
// Licensed under Apache License 2.0
|
||||
//
|
||||
// https://github.com/danielgindi/Charts
|
||||
//
|
||||
|
||||
import Foundation
|
||||
import CoreGraphics
|
||||
|
||||
|
||||
/// Implementation of the RadarChart, a "spidernet"-like chart. It works best
|
||||
/// when displaying 5-10 entries per DataSet.
|
||||
open class RadarChartView: PieRadarChartViewBase
|
||||
{
|
||||
/// width of the web lines that come from the center.
|
||||
@objc open var webLineWidth = CGFloat(1.5)
|
||||
|
||||
/// width of the web lines that are in between the lines coming from the center
|
||||
@objc open var innerWebLineWidth = CGFloat(0.75)
|
||||
|
||||
/// color for the web lines that come from the center
|
||||
@objc open var webColor = NSUIColor(red: 122/255.0, green: 122/255.0, blue: 122.0/255.0, alpha: 1.0)
|
||||
|
||||
/// color for the web lines in between the lines that come from the center.
|
||||
@objc open var innerWebColor = NSUIColor(red: 122/255.0, green: 122/255.0, blue: 122.0/255.0, alpha: 1.0)
|
||||
|
||||
/// transparency the grid is drawn with (0.0 - 1.0)
|
||||
@objc open var webAlpha: CGFloat = 150.0 / 255.0
|
||||
|
||||
/// flag indicating if the web lines should be drawn or not
|
||||
@objc open var drawWeb = true
|
||||
|
||||
/// modulus that determines how many labels and web-lines are skipped before the next is drawn
|
||||
private var _skipWebLineCount = 0
|
||||
|
||||
/// the object reprsenting the y-axis labels
|
||||
private var _yAxis: YAxis!
|
||||
|
||||
internal var _yAxisRenderer: YAxisRendererRadarChart!
|
||||
internal var _xAxisRenderer: XAxisRendererRadarChart!
|
||||
|
||||
public override init(frame: CGRect)
|
||||
{
|
||||
super.init(frame: frame)
|
||||
}
|
||||
|
||||
public required init?(coder aDecoder: NSCoder)
|
||||
{
|
||||
super.init(coder: aDecoder)
|
||||
}
|
||||
|
||||
internal override func initialize()
|
||||
{
|
||||
super.initialize()
|
||||
|
||||
_yAxis = YAxis(position: .left)
|
||||
|
||||
renderer = RadarChartRenderer(chart: self, animator: _animator, viewPortHandler: _viewPortHandler)
|
||||
|
||||
_yAxisRenderer = YAxisRendererRadarChart(viewPortHandler: _viewPortHandler, yAxis: _yAxis, chart: self)
|
||||
_xAxisRenderer = XAxisRendererRadarChart(viewPortHandler: _viewPortHandler, xAxis: _xAxis, chart: self)
|
||||
|
||||
self.highlighter = RadarHighlighter(chart: self)
|
||||
}
|
||||
|
||||
internal override func calcMinMax()
|
||||
{
|
||||
super.calcMinMax()
|
||||
|
||||
guard let data = _data else { return }
|
||||
|
||||
_yAxis.calculate(min: data.getYMin(axis: .left), max: data.getYMax(axis: .left))
|
||||
_xAxis.calculate(min: 0.0, max: Double(data.maxEntryCountSet?.entryCount ?? 0))
|
||||
}
|
||||
|
||||
open override func notifyDataSetChanged()
|
||||
{
|
||||
calcMinMax()
|
||||
|
||||
_yAxisRenderer?.computeAxis(min: _yAxis._axisMinimum, max: _yAxis._axisMaximum, inverted: _yAxis.isInverted)
|
||||
_xAxisRenderer?.computeAxis(min: _xAxis._axisMinimum, max: _xAxis._axisMaximum, inverted: false)
|
||||
|
||||
if let data = _data,
|
||||
let legend = _legend,
|
||||
!legend.isLegendCustom
|
||||
{
|
||||
legendRenderer?.computeLegend(data: data)
|
||||
}
|
||||
|
||||
calculateOffsets()
|
||||
|
||||
setNeedsDisplay()
|
||||
}
|
||||
|
||||
open override func draw(_ rect: CGRect)
|
||||
{
|
||||
super.draw(rect)
|
||||
|
||||
guard data != nil, let renderer = renderer else { return }
|
||||
|
||||
let optionalContext = NSUIGraphicsGetCurrentContext()
|
||||
guard let context = optionalContext else { return }
|
||||
|
||||
if _xAxis.isEnabled
|
||||
{
|
||||
_xAxisRenderer.computeAxis(min: _xAxis._axisMinimum, max: _xAxis._axisMaximum, inverted: false)
|
||||
}
|
||||
|
||||
_xAxisRenderer?.renderAxisLabels(context: context)
|
||||
|
||||
if drawWeb
|
||||
{
|
||||
renderer.drawExtras(context: context)
|
||||
}
|
||||
|
||||
if _yAxis.isEnabled && _yAxis.isDrawLimitLinesBehindDataEnabled
|
||||
{
|
||||
_yAxisRenderer.renderLimitLines(context: context)
|
||||
}
|
||||
|
||||
renderer.drawData(context: context)
|
||||
|
||||
if valuesToHighlight()
|
||||
{
|
||||
renderer.drawHighlighted(context: context, indices: _indicesToHighlight)
|
||||
}
|
||||
|
||||
if _yAxis.isEnabled && !_yAxis.isDrawLimitLinesBehindDataEnabled
|
||||
{
|
||||
_yAxisRenderer.renderLimitLines(context: context)
|
||||
}
|
||||
|
||||
_yAxisRenderer.renderAxisLabels(context: context)
|
||||
|
||||
renderer.drawValues(context: context)
|
||||
|
||||
legendRenderer.renderLegend(context: context)
|
||||
|
||||
drawDescription(context: context)
|
||||
|
||||
drawMarkers(context: context)
|
||||
}
|
||||
|
||||
/// - returns: The factor that is needed to transform values into pixels.
|
||||
@objc open var factor: CGFloat
|
||||
{
|
||||
let content = _viewPortHandler.contentRect
|
||||
return min(content.width / 2.0, content.height / 2.0)
|
||||
/ CGFloat(_yAxis.axisRange)
|
||||
}
|
||||
|
||||
/// - returns: The angle that each slice in the radar chart occupies.
|
||||
@objc open var sliceAngle: CGFloat
|
||||
{
|
||||
return 360.0 / CGFloat(_data?.maxEntryCountSet?.entryCount ?? 0)
|
||||
}
|
||||
|
||||
open override func indexForAngle(_ angle: CGFloat) -> Int
|
||||
{
|
||||
// take the current angle of the chart into consideration
|
||||
let a = (angle - self.rotationAngle).normalizedAngle
|
||||
|
||||
let sliceAngle = self.sliceAngle
|
||||
|
||||
let max = _data?.maxEntryCountSet?.entryCount ?? 0
|
||||
|
||||
var index = 0
|
||||
|
||||
for i in 0..<max
|
||||
{
|
||||
let referenceAngle = sliceAngle * CGFloat(i + 1) - sliceAngle / 2.0
|
||||
|
||||
if referenceAngle > a
|
||||
{
|
||||
index = i
|
||||
break
|
||||
}
|
||||
}
|
||||
|
||||
return index
|
||||
}
|
||||
|
||||
/// - returns: The object that represents all y-labels of the RadarChart.
|
||||
@objc open var yAxis: YAxis
|
||||
{
|
||||
return _yAxis
|
||||
}
|
||||
|
||||
/// Sets the number of web-lines that should be skipped on chart web before the next one is drawn. This targets the lines that come from the center of the RadarChart.
|
||||
/// if count = 1 -> 1 line is skipped in between
|
||||
@objc open var skipWebLineCount: Int
|
||||
{
|
||||
get
|
||||
{
|
||||
return _skipWebLineCount
|
||||
}
|
||||
set
|
||||
{
|
||||
_skipWebLineCount = max(0, newValue)
|
||||
}
|
||||
}
|
||||
|
||||
internal override var requiredLegendOffset: CGFloat
|
||||
{
|
||||
return _legend.font.pointSize * 4.0
|
||||
}
|
||||
|
||||
internal override var requiredBaseOffset: CGFloat
|
||||
{
|
||||
return _xAxis.isEnabled && _xAxis.isDrawLabelsEnabled ? _xAxis.labelRotatedWidth : 10.0
|
||||
}
|
||||
|
||||
open override var radius: CGFloat
|
||||
{
|
||||
let content = _viewPortHandler.contentRect
|
||||
return min(content.width / 2.0, content.height / 2.0)
|
||||
}
|
||||
|
||||
/// - returns: The maximum value this chart can display on it's y-axis.
|
||||
open override var chartYMax: Double { return _yAxis._axisMaximum }
|
||||
|
||||
/// - returns: The minimum value this chart can display on it's y-axis.
|
||||
open override var chartYMin: Double { return _yAxis._axisMinimum }
|
||||
|
||||
/// - returns: The range of y-values this chart can display.
|
||||
@objc open var yRange: Double { return _yAxis.axisRange }
|
||||
}
|
||||
31
Pods/Charts/Source/Charts/Charts/ScatterChartView.swift
generated
Normal file
31
Pods/Charts/Source/Charts/Charts/ScatterChartView.swift
generated
Normal file
@@ -0,0 +1,31 @@
|
||||
//
|
||||
// ScatterChartView.swift
|
||||
// Charts
|
||||
//
|
||||
// Copyright 2015 Daniel Cohen Gindi & Philipp Jahoda
|
||||
// A port of MPAndroidChart for iOS
|
||||
// Licensed under Apache License 2.0
|
||||
//
|
||||
// https://github.com/danielgindi/Charts
|
||||
//
|
||||
|
||||
import Foundation
|
||||
import CoreGraphics
|
||||
|
||||
/// The ScatterChart. Draws dots, triangles, squares and custom shapes into the chartview.
|
||||
open class ScatterChartView: BarLineChartViewBase, ScatterChartDataProvider
|
||||
{
|
||||
open override func initialize()
|
||||
{
|
||||
super.initialize()
|
||||
|
||||
renderer = ScatterChartRenderer(dataProvider: self, animator: _animator, viewPortHandler: _viewPortHandler)
|
||||
|
||||
xAxis.spaceMin = 0.5
|
||||
xAxis.spaceMax = 0.5
|
||||
}
|
||||
|
||||
// MARK: - ScatterChartDataProvider
|
||||
|
||||
open var scatterData: ScatterChartData? { return _data as? ScatterChartData }
|
||||
}
|
||||
371
Pods/Charts/Source/Charts/Components/AxisBase.swift
generated
Normal file
371
Pods/Charts/Source/Charts/Components/AxisBase.swift
generated
Normal file
@@ -0,0 +1,371 @@
|
||||
//
|
||||
// AxisBase.swift
|
||||
// Charts
|
||||
//
|
||||
// Copyright 2015 Daniel Cohen Gindi & Philipp Jahoda
|
||||
// A port of MPAndroidChart for iOS
|
||||
// Licensed under Apache License 2.0
|
||||
//
|
||||
// https://github.com/danielgindi/Charts
|
||||
//
|
||||
|
||||
import Foundation
|
||||
import CoreGraphics
|
||||
|
||||
/// Base class for all axes
|
||||
@objc(ChartAxisBase)
|
||||
open class AxisBase: ComponentBase
|
||||
{
|
||||
public override init()
|
||||
{
|
||||
super.init()
|
||||
}
|
||||
|
||||
/// Custom formatter that is used instead of the auto-formatter if set
|
||||
private var _axisValueFormatter: IAxisValueFormatter?
|
||||
|
||||
@objc open var labelFont = NSUIFont.systemFont(ofSize: 10.0)
|
||||
@objc open var labelTextColor = NSUIColor.black
|
||||
|
||||
@objc open var axisLineColor = NSUIColor.gray
|
||||
@objc open var axisLineWidth = CGFloat(0.5)
|
||||
@objc open var axisLineDashPhase = CGFloat(0.0)
|
||||
@objc open var axisLineDashLengths: [CGFloat]!
|
||||
|
||||
@objc open var gridColor = NSUIColor.gray.withAlphaComponent(0.9)
|
||||
@objc open var gridLineWidth = CGFloat(0.5)
|
||||
@objc open var gridLineDashPhase = CGFloat(0.0)
|
||||
@objc open var gridLineDashLengths: [CGFloat]!
|
||||
@objc open var gridLineCap = CGLineCap.butt
|
||||
|
||||
@objc open var drawGridLinesEnabled = true
|
||||
@objc open var drawAxisLineEnabled = true
|
||||
|
||||
/// flag that indicates of the labels of this axis should be drawn or not
|
||||
@objc open var drawLabelsEnabled = true
|
||||
|
||||
private var _centerAxisLabelsEnabled = false
|
||||
|
||||
/// Centers the axis labels instead of drawing them at their original position.
|
||||
/// This is useful especially for grouped BarChart.
|
||||
@objc open var centerAxisLabelsEnabled: Bool
|
||||
{
|
||||
get { return _centerAxisLabelsEnabled && entryCount > 0 }
|
||||
set { _centerAxisLabelsEnabled = newValue }
|
||||
}
|
||||
|
||||
@objc open var isCenterAxisLabelsEnabled: Bool
|
||||
{
|
||||
get { return centerAxisLabelsEnabled }
|
||||
}
|
||||
|
||||
/// array of limitlines that can be set for the axis
|
||||
private var _limitLines = [ChartLimitLine]()
|
||||
|
||||
/// Are the LimitLines drawn behind the data or in front of the data?
|
||||
///
|
||||
/// **default**: false
|
||||
@objc open var drawLimitLinesBehindDataEnabled = false
|
||||
|
||||
/// the flag can be used to turn off the antialias for grid lines
|
||||
@objc open var gridAntialiasEnabled = true
|
||||
|
||||
/// the actual array of entries
|
||||
@objc open var entries = [Double]()
|
||||
|
||||
/// axis label entries only used for centered labels
|
||||
@objc open var centeredEntries = [Double]()
|
||||
|
||||
/// the number of entries the legend contains
|
||||
@objc open var entryCount: Int { return entries.count }
|
||||
|
||||
/// the number of label entries the axis should have
|
||||
///
|
||||
/// **default**: 6
|
||||
private var _labelCount = Int(6)
|
||||
|
||||
/// the number of decimal digits to use (for the default formatter
|
||||
@objc open var decimals: Int = 0
|
||||
|
||||
/// When true, axis labels are controlled by the `granularity` property.
|
||||
/// When false, axis values could possibly be repeated.
|
||||
/// This could happen if two adjacent axis values are rounded to same value.
|
||||
/// If using granularity this could be avoided by having fewer axis values visible.
|
||||
@objc open var granularityEnabled = false
|
||||
|
||||
private var _granularity = Double(1.0)
|
||||
|
||||
/// The minimum interval between axis values.
|
||||
/// This can be used to avoid label duplicating when zooming in.
|
||||
///
|
||||
/// **default**: 1.0
|
||||
@objc open var granularity: Double
|
||||
{
|
||||
get
|
||||
{
|
||||
return _granularity
|
||||
}
|
||||
set
|
||||
{
|
||||
_granularity = newValue
|
||||
|
||||
// set this to `true` if it was disabled, as it makes no sense to set this property with granularity disabled
|
||||
granularityEnabled = true
|
||||
}
|
||||
}
|
||||
|
||||
/// The minimum interval between axis values.
|
||||
@objc open var isGranularityEnabled: Bool
|
||||
{
|
||||
get
|
||||
{
|
||||
return granularityEnabled
|
||||
}
|
||||
}
|
||||
|
||||
/// if true, the set number of y-labels will be forced
|
||||
@objc open var forceLabelsEnabled = false
|
||||
|
||||
@objc open func getLongestLabel() -> String
|
||||
{
|
||||
var longest = ""
|
||||
|
||||
for i in 0 ..< entries.count
|
||||
{
|
||||
let text = getFormattedLabel(i)
|
||||
|
||||
if longest.count < text.count
|
||||
{
|
||||
longest = text
|
||||
}
|
||||
}
|
||||
|
||||
return longest
|
||||
}
|
||||
|
||||
/// - returns: The formatted label at the specified index. This will either use the auto-formatter or the custom formatter (if one is set).
|
||||
@objc open func getFormattedLabel(_ index: Int) -> String
|
||||
{
|
||||
if index < 0 || index >= entries.count
|
||||
{
|
||||
return ""
|
||||
}
|
||||
|
||||
return valueFormatter?.stringForValue(entries[index], axis: self) ?? ""
|
||||
}
|
||||
|
||||
/// Sets the formatter to be used for formatting the axis labels.
|
||||
/// If no formatter is set, the chart will automatically determine a reasonable formatting (concerning decimals) for all the values that are drawn inside the chart.
|
||||
/// Use `nil` to use the formatter calculated by the chart.
|
||||
@objc open var valueFormatter: IAxisValueFormatter?
|
||||
{
|
||||
get
|
||||
{
|
||||
if _axisValueFormatter == nil ||
|
||||
(_axisValueFormatter is DefaultAxisValueFormatter &&
|
||||
(_axisValueFormatter as! DefaultAxisValueFormatter).hasAutoDecimals &&
|
||||
(_axisValueFormatter as! DefaultAxisValueFormatter).decimals != decimals)
|
||||
{
|
||||
_axisValueFormatter = DefaultAxisValueFormatter(decimals: decimals)
|
||||
}
|
||||
|
||||
return _axisValueFormatter
|
||||
}
|
||||
set
|
||||
{
|
||||
_axisValueFormatter = newValue ?? DefaultAxisValueFormatter(decimals: decimals)
|
||||
}
|
||||
}
|
||||
|
||||
@objc open var isDrawGridLinesEnabled: Bool { return drawGridLinesEnabled }
|
||||
|
||||
@objc open var isDrawAxisLineEnabled: Bool { return drawAxisLineEnabled }
|
||||
|
||||
@objc open var isDrawLabelsEnabled: Bool { return drawLabelsEnabled }
|
||||
|
||||
/// Are the LimitLines drawn behind the data or in front of the data?
|
||||
///
|
||||
/// **default**: false
|
||||
@objc open var isDrawLimitLinesBehindDataEnabled: Bool { return drawLimitLinesBehindDataEnabled }
|
||||
|
||||
/// Extra spacing for `axisMinimum` to be added to automatically calculated `axisMinimum`
|
||||
@objc open var spaceMin: Double = 0.0
|
||||
|
||||
/// Extra spacing for `axisMaximum` to be added to automatically calculated `axisMaximum`
|
||||
@objc open var spaceMax: Double = 0.0
|
||||
|
||||
/// Flag indicating that the axis-min value has been customized
|
||||
internal var _customAxisMin: Bool = false
|
||||
|
||||
/// Flag indicating that the axis-max value has been customized
|
||||
internal var _customAxisMax: Bool = false
|
||||
|
||||
/// Do not touch this directly, instead, use axisMinimum.
|
||||
/// This is automatically calculated to represent the real min value,
|
||||
/// and is used when calculating the effective minimum.
|
||||
internal var _axisMinimum = Double(0)
|
||||
|
||||
/// Do not touch this directly, instead, use axisMaximum.
|
||||
/// This is automatically calculated to represent the real max value,
|
||||
/// and is used when calculating the effective maximum.
|
||||
internal var _axisMaximum = Double(0)
|
||||
|
||||
/// the total range of values this axis covers
|
||||
@objc open var axisRange = Double(0)
|
||||
|
||||
/// The minumum number of labels on the axis
|
||||
@objc open var axisMinLabels = Int(2) {
|
||||
didSet { axisMinLabels = axisMinLabels > 0 ? axisMinLabels : oldValue }
|
||||
}
|
||||
|
||||
/// The maximum number of labels on the axis
|
||||
@objc open var axisMaxLabels = Int(25) {
|
||||
didSet { axisMinLabels = axisMaxLabels > 0 ? axisMaxLabels : oldValue }
|
||||
}
|
||||
|
||||
/// the number of label entries the axis should have
|
||||
/// max = 25,
|
||||
/// min = 2,
|
||||
/// default = 6,
|
||||
/// be aware that this number is not fixed and can only be approximated
|
||||
@objc open var labelCount: Int
|
||||
{
|
||||
get
|
||||
{
|
||||
return _labelCount
|
||||
}
|
||||
set
|
||||
{
|
||||
_labelCount = newValue
|
||||
|
||||
if _labelCount > axisMaxLabels
|
||||
{
|
||||
_labelCount = axisMaxLabels
|
||||
}
|
||||
if _labelCount < axisMinLabels
|
||||
{
|
||||
_labelCount = axisMinLabels
|
||||
}
|
||||
|
||||
forceLabelsEnabled = false
|
||||
}
|
||||
}
|
||||
|
||||
@objc open func setLabelCount(_ count: Int, force: Bool)
|
||||
{
|
||||
self.labelCount = count
|
||||
forceLabelsEnabled = force
|
||||
}
|
||||
|
||||
/// - returns: `true` if focing the y-label count is enabled. Default: false
|
||||
@objc open var isForceLabelsEnabled: Bool { return forceLabelsEnabled }
|
||||
|
||||
/// Adds a new ChartLimitLine to this axis.
|
||||
@objc open func addLimitLine(_ line: ChartLimitLine)
|
||||
{
|
||||
_limitLines.append(line)
|
||||
}
|
||||
|
||||
/// Removes the specified ChartLimitLine from the axis.
|
||||
@objc open func removeLimitLine(_ line: ChartLimitLine)
|
||||
{
|
||||
for i in 0 ..< _limitLines.count
|
||||
{
|
||||
if _limitLines[i] === line
|
||||
{
|
||||
_limitLines.remove(at: i)
|
||||
return
|
||||
}
|
||||
}
|
||||
}
|
||||
|
||||
/// Removes all LimitLines from the axis.
|
||||
@objc open func removeAllLimitLines()
|
||||
{
|
||||
_limitLines.removeAll(keepingCapacity: false)
|
||||
}
|
||||
|
||||
/// - returns: The LimitLines of this axis.
|
||||
@objc open var limitLines : [ChartLimitLine]
|
||||
{
|
||||
return _limitLines
|
||||
}
|
||||
|
||||
// MARK: Custom axis ranges
|
||||
|
||||
/// By calling this method, any custom minimum value that has been previously set is reseted, and the calculation is done automatically.
|
||||
@objc open func resetCustomAxisMin()
|
||||
{
|
||||
_customAxisMin = false
|
||||
}
|
||||
|
||||
@objc open var isAxisMinCustom: Bool { return _customAxisMin }
|
||||
|
||||
/// By calling this method, any custom maximum value that has been previously set is reseted, and the calculation is done automatically.
|
||||
@objc open func resetCustomAxisMax()
|
||||
{
|
||||
_customAxisMax = false
|
||||
}
|
||||
|
||||
@objc open var isAxisMaxCustom: Bool { return _customAxisMax }
|
||||
|
||||
/// The minimum value for this axis.
|
||||
/// If set, this value will not be calculated automatically depending on the provided data.
|
||||
/// Use `resetCustomAxisMin()` to undo this.
|
||||
@objc open var axisMinimum: Double
|
||||
{
|
||||
get
|
||||
{
|
||||
return _axisMinimum
|
||||
}
|
||||
set
|
||||
{
|
||||
_customAxisMin = true
|
||||
_axisMinimum = newValue
|
||||
axisRange = abs(_axisMaximum - newValue)
|
||||
}
|
||||
}
|
||||
|
||||
/// The maximum value for this axis.
|
||||
/// If set, this value will not be calculated automatically depending on the provided data.
|
||||
/// Use `resetCustomAxisMax()` to undo this.
|
||||
@objc open var axisMaximum: Double
|
||||
{
|
||||
get
|
||||
{
|
||||
return _axisMaximum
|
||||
}
|
||||
set
|
||||
{
|
||||
_customAxisMax = true
|
||||
_axisMaximum = newValue
|
||||
axisRange = abs(newValue - _axisMinimum)
|
||||
}
|
||||
}
|
||||
|
||||
/// Calculates the minimum, maximum and range values of the YAxis with the given minimum and maximum values from the chart data.
|
||||
/// - parameter dataMin: the y-min value according to chart data
|
||||
/// - parameter dataMax: the y-max value according to chart
|
||||
@objc open func calculate(min dataMin: Double, max dataMax: Double)
|
||||
{
|
||||
// if custom, use value as is, else use data value
|
||||
var min = _customAxisMin ? _axisMinimum : (dataMin - spaceMin)
|
||||
var max = _customAxisMax ? _axisMaximum : (dataMax + spaceMax)
|
||||
|
||||
// temporary range (before calculations)
|
||||
let range = abs(max - min)
|
||||
|
||||
// in case all values are equal
|
||||
if range == 0.0
|
||||
{
|
||||
max = max + 1.0
|
||||
min = min - 1.0
|
||||
}
|
||||
|
||||
_axisMinimum = min
|
||||
_axisMaximum = max
|
||||
|
||||
// actual range
|
||||
axisRange = abs(max - min)
|
||||
}
|
||||
}
|
||||
85
Pods/Charts/Source/Charts/Components/ChartLimitLine.swift
generated
Normal file
85
Pods/Charts/Source/Charts/Components/ChartLimitLine.swift
generated
Normal file
@@ -0,0 +1,85 @@
|
||||
//
|
||||
// ChartLimitLine.swift
|
||||
// Charts
|
||||
//
|
||||
// Copyright 2015 Daniel Cohen Gindi & Philipp Jahoda
|
||||
// A port of MPAndroidChart for iOS
|
||||
// Licensed under Apache License 2.0
|
||||
//
|
||||
// https://github.com/danielgindi/Charts
|
||||
//
|
||||
|
||||
import Foundation
|
||||
import CoreGraphics
|
||||
|
||||
|
||||
/// The limit line is an additional feature for all Line, Bar and ScatterCharts.
|
||||
/// It allows the displaying of an additional line in the chart that marks a certain maximum / limit on the specified axis (x- or y-axis).
|
||||
open class ChartLimitLine: ComponentBase
|
||||
{
|
||||
@objc(ChartLimitLabelPosition)
|
||||
public enum LabelPosition: Int
|
||||
{
|
||||
case leftTop
|
||||
case leftBottom
|
||||
case rightTop
|
||||
case rightBottom
|
||||
}
|
||||
|
||||
/// limit / maximum (the y-value or xIndex)
|
||||
@objc open var limit = Double(0.0)
|
||||
|
||||
private var _lineWidth = CGFloat(2.0)
|
||||
@objc open var lineColor = NSUIColor(red: 237.0/255.0, green: 91.0/255.0, blue: 91.0/255.0, alpha: 1.0)
|
||||
@objc open var lineDashPhase = CGFloat(0.0)
|
||||
@objc open var lineDashLengths: [CGFloat]?
|
||||
|
||||
@objc open var valueTextColor = NSUIColor.black
|
||||
@objc open var valueFont = NSUIFont.systemFont(ofSize: 13.0)
|
||||
|
||||
@objc open var drawLabelEnabled = true
|
||||
@objc open var label = ""
|
||||
@objc open var labelPosition = LabelPosition.rightTop
|
||||
|
||||
public override init()
|
||||
{
|
||||
super.init()
|
||||
}
|
||||
|
||||
@objc public init(limit: Double)
|
||||
{
|
||||
super.init()
|
||||
self.limit = limit
|
||||
}
|
||||
|
||||
@objc public init(limit: Double, label: String)
|
||||
{
|
||||
super.init()
|
||||
self.limit = limit
|
||||
self.label = label
|
||||
}
|
||||
|
||||
/// set the line width of the chart (min = 0.2, max = 12); default 2
|
||||
@objc open var lineWidth: CGFloat
|
||||
{
|
||||
get
|
||||
{
|
||||
return _lineWidth
|
||||
}
|
||||
set
|
||||
{
|
||||
if newValue < 0.2
|
||||
{
|
||||
_lineWidth = 0.2
|
||||
}
|
||||
else if newValue > 12.0
|
||||
{
|
||||
_lineWidth = 12.0
|
||||
}
|
||||
else
|
||||
{
|
||||
_lineWidth = newValue
|
||||
}
|
||||
}
|
||||
}
|
||||
}
|
||||
37
Pods/Charts/Source/Charts/Components/ComponentBase.swift
generated
Normal file
37
Pods/Charts/Source/Charts/Components/ComponentBase.swift
generated
Normal file
@@ -0,0 +1,37 @@
|
||||
//
|
||||
// ComponentBase.swift
|
||||
// Charts
|
||||
//
|
||||
// Copyright 2015 Daniel Cohen Gindi & Philipp Jahoda
|
||||
// A port of MPAndroidChart for iOS
|
||||
// Licensed under Apache License 2.0
|
||||
//
|
||||
// https://github.com/danielgindi/Charts
|
||||
//
|
||||
|
||||
import Foundation
|
||||
import CoreGraphics
|
||||
|
||||
|
||||
/// This class encapsulates everything both Axis, Legend and LimitLines have in common
|
||||
@objc(ChartComponentBase)
|
||||
open class ComponentBase: NSObject
|
||||
{
|
||||
/// flag that indicates if this component is enabled or not
|
||||
@objc open var enabled = true
|
||||
|
||||
/// The offset this component has on the x-axis
|
||||
/// **default**: 5.0
|
||||
@objc open var xOffset = CGFloat(5.0)
|
||||
|
||||
/// The offset this component has on the x-axis
|
||||
/// **default**: 5.0 (or 0.0 on ChartYAxis)
|
||||
@objc open var yOffset = CGFloat(5.0)
|
||||
|
||||
public override init()
|
||||
{
|
||||
super.init()
|
||||
}
|
||||
|
||||
@objc open var isEnabled: Bool { return enabled }
|
||||
}
|
||||
50
Pods/Charts/Source/Charts/Components/Description.swift
generated
Normal file
50
Pods/Charts/Source/Charts/Components/Description.swift
generated
Normal file
@@ -0,0 +1,50 @@
|
||||
//
|
||||
// Description.swift
|
||||
// Charts
|
||||
//
|
||||
// Copyright 2015 Daniel Cohen Gindi & Philipp Jahoda
|
||||
// A port of MPAndroidChart for iOS
|
||||
// Licensed under Apache License 2.0
|
||||
//
|
||||
// https://github.com/danielgindi/Charts
|
||||
//
|
||||
|
||||
import Foundation
|
||||
import CoreGraphics
|
||||
|
||||
#if !os(OSX)
|
||||
import UIKit
|
||||
#endif
|
||||
|
||||
@objc(ChartDescription)
|
||||
open class Description: ComponentBase
|
||||
{
|
||||
public override init()
|
||||
{
|
||||
#if os(tvOS)
|
||||
// 23 is the smallest recommended font size on the TV
|
||||
font = NSUIFont.systemFont(ofSize: 23)
|
||||
#elseif os(OSX)
|
||||
font = NSUIFont.systemFont(ofSize: NSUIFont.systemFontSize)
|
||||
#else
|
||||
font = NSUIFont.systemFont(ofSize: 8.0)
|
||||
#endif
|
||||
|
||||
super.init()
|
||||
}
|
||||
|
||||
/// The text to be shown as the description.
|
||||
@objc open var text: String? = "Description Label"
|
||||
|
||||
/// Custom position for the description text in pixels on the screen.
|
||||
open var position: CGPoint? = nil
|
||||
|
||||
/// The text alignment of the description text. Default RIGHT.
|
||||
@objc open var textAlign: NSTextAlignment = NSTextAlignment.right
|
||||
|
||||
/// Font object used for drawing the description text.
|
||||
@objc open var font: NSUIFont
|
||||
|
||||
/// Text color used for drawing the description text
|
||||
@objc open var textColor = NSUIColor.black
|
||||
}
|
||||
40
Pods/Charts/Source/Charts/Components/IMarker.swift
generated
Normal file
40
Pods/Charts/Source/Charts/Components/IMarker.swift
generated
Normal file
@@ -0,0 +1,40 @@
|
||||
//
|
||||
// ChartMarker.swift
|
||||
// Charts
|
||||
//
|
||||
// Copyright 2015 Daniel Cohen Gindi & Philipp Jahoda
|
||||
// A port of MPAndroidChart for iOS
|
||||
// Licensed under Apache License 2.0
|
||||
//
|
||||
// https://github.com/danielgindi/Charts
|
||||
//
|
||||
|
||||
import Foundation
|
||||
import CoreGraphics
|
||||
|
||||
@objc(IChartMarker)
|
||||
public protocol IMarker: class
|
||||
{
|
||||
/// - returns: The desired (general) offset you wish the IMarker to have on the x-axis.
|
||||
///
|
||||
/// By returning x: -(width / 2) you will center the IMarker horizontally.
|
||||
///
|
||||
/// By returning y: -(height / 2) you will center the IMarker vertically.
|
||||
var offset: CGPoint { get }
|
||||
|
||||
/// - returns: The offset for drawing at the specific `point`.
|
||||
/// This allows conditional adjusting of the Marker position.
|
||||
/// If you have no adjustments to make, return self.offset().
|
||||
///
|
||||
/// - parameter point: This is the point at which the marker wants to be drawn. You can adjust the offset conditionally based on this argument.
|
||||
func offsetForDrawing(atPoint: CGPoint) -> CGPoint
|
||||
|
||||
/// This method enables a custom IMarker to update it's content every time the IMarker is redrawn according to the data entry it points to.
|
||||
///
|
||||
/// - parameter entry: The Entry the IMarker belongs to. This can also be any subclass of Entry, like BarEntry or CandleEntry, simply cast it at runtime.
|
||||
/// - parameter highlight: The highlight object contains information about the highlighted value such as it's dataset-index, the selected range or stack-index (only stacked bar entries).
|
||||
func refreshContent(entry: ChartDataEntry, highlight: Highlight)
|
||||
|
||||
/// Draws the IMarker on the given position on the given context
|
||||
func draw(context: CGContext, point: CGPoint)
|
||||
}
|
||||
428
Pods/Charts/Source/Charts/Components/Legend.swift
generated
Normal file
428
Pods/Charts/Source/Charts/Components/Legend.swift
generated
Normal file
@@ -0,0 +1,428 @@
|
||||
//
|
||||
// Legend.swift
|
||||
// Charts
|
||||
//
|
||||
// Copyright 2015 Daniel Cohen Gindi & Philipp Jahoda
|
||||
// A port of MPAndroidChart for iOS
|
||||
// Licensed under Apache License 2.0
|
||||
//
|
||||
// https://github.com/danielgindi/Charts
|
||||
//
|
||||
|
||||
import Foundation
|
||||
import CoreGraphics
|
||||
|
||||
#if !os(OSX)
|
||||
import UIKit
|
||||
#endif
|
||||
|
||||
@objc(ChartLegend)
|
||||
open class Legend: ComponentBase
|
||||
{
|
||||
@objc(ChartLegendForm)
|
||||
public enum Form: Int
|
||||
{
|
||||
/// Avoid drawing a form
|
||||
case none
|
||||
|
||||
/// Do not draw the a form, but leave space for it
|
||||
case empty
|
||||
|
||||
/// Use default (default dataset's form to the legend's form)
|
||||
case `default`
|
||||
|
||||
/// Draw a square
|
||||
case square
|
||||
|
||||
/// Draw a circle
|
||||
case circle
|
||||
|
||||
/// Draw a horizontal line
|
||||
case line
|
||||
}
|
||||
|
||||
@objc(ChartLegendHorizontalAlignment)
|
||||
public enum HorizontalAlignment: Int
|
||||
{
|
||||
case left
|
||||
case center
|
||||
case right
|
||||
}
|
||||
|
||||
@objc(ChartLegendVerticalAlignment)
|
||||
public enum VerticalAlignment: Int
|
||||
{
|
||||
case top
|
||||
case center
|
||||
case bottom
|
||||
}
|
||||
|
||||
@objc(ChartLegendOrientation)
|
||||
public enum Orientation: Int
|
||||
{
|
||||
case horizontal
|
||||
case vertical
|
||||
}
|
||||
|
||||
@objc(ChartLegendDirection)
|
||||
public enum Direction: Int
|
||||
{
|
||||
case leftToRight
|
||||
case rightToLeft
|
||||
}
|
||||
|
||||
/// The legend entries array
|
||||
@objc open var entries = [LegendEntry]()
|
||||
|
||||
/// Entries that will be appended to the end of the auto calculated entries after calculating the legend.
|
||||
/// (if the legend has already been calculated, you will need to call notifyDataSetChanged() to let the changes take effect)
|
||||
@objc open var extraEntries = [LegendEntry]()
|
||||
|
||||
/// Are the legend labels/colors a custom value or auto calculated? If false, then it's auto, if true, then custom.
|
||||
///
|
||||
/// **default**: false (automatic legend)
|
||||
private var _isLegendCustom = false
|
||||
|
||||
/// The horizontal alignment of the legend
|
||||
@objc open var horizontalAlignment: HorizontalAlignment = HorizontalAlignment.left
|
||||
|
||||
/// The vertical alignment of the legend
|
||||
@objc open var verticalAlignment: VerticalAlignment = VerticalAlignment.bottom
|
||||
|
||||
/// The orientation of the legend
|
||||
@objc open var orientation: Orientation = Orientation.horizontal
|
||||
|
||||
/// Flag indicating whether the legend will draw inside the chart or outside
|
||||
@objc open var drawInside: Bool = false
|
||||
|
||||
/// Flag indicating whether the legend will draw inside the chart or outside
|
||||
@objc open var isDrawInsideEnabled: Bool { return drawInside }
|
||||
|
||||
/// The text direction of the legend
|
||||
@objc open var direction: Direction = Direction.leftToRight
|
||||
|
||||
@objc open var font: NSUIFont = NSUIFont.systemFont(ofSize: 10.0)
|
||||
@objc open var textColor = NSUIColor.black
|
||||
|
||||
/// The form/shape of the legend forms
|
||||
@objc open var form = Form.square
|
||||
|
||||
/// The size of the legend forms
|
||||
@objc open var formSize = CGFloat(8.0)
|
||||
|
||||
/// The line width for forms that consist of lines
|
||||
@objc open var formLineWidth = CGFloat(3.0)
|
||||
|
||||
/// Line dash configuration for shapes that consist of lines.
|
||||
///
|
||||
/// This is how much (in pixels) into the dash pattern are we starting from.
|
||||
@objc open var formLineDashPhase: CGFloat = 0.0
|
||||
|
||||
/// Line dash configuration for shapes that consist of lines.
|
||||
///
|
||||
/// This is the actual dash pattern.
|
||||
/// I.e. [2, 3] will paint [-- -- ]
|
||||
/// [1, 3, 4, 2] will paint [- ---- - ---- ]
|
||||
@objc open var formLineDashLengths: [CGFloat]?
|
||||
|
||||
@objc open var xEntrySpace = CGFloat(6.0)
|
||||
@objc open var yEntrySpace = CGFloat(0.0)
|
||||
@objc open var formToTextSpace = CGFloat(5.0)
|
||||
@objc open var stackSpace = CGFloat(3.0)
|
||||
|
||||
@objc open var calculatedLabelSizes = [CGSize]()
|
||||
@objc open var calculatedLabelBreakPoints = [Bool]()
|
||||
@objc open var calculatedLineSizes = [CGSize]()
|
||||
|
||||
public override init()
|
||||
{
|
||||
super.init()
|
||||
|
||||
self.xOffset = 5.0
|
||||
self.yOffset = 3.0
|
||||
}
|
||||
|
||||
@objc public init(entries: [LegendEntry])
|
||||
{
|
||||
super.init()
|
||||
|
||||
self.entries = entries
|
||||
}
|
||||
|
||||
@objc open func getMaximumEntrySize(withFont font: NSUIFont) -> CGSize
|
||||
{
|
||||
var maxW = CGFloat(0.0)
|
||||
var maxH = CGFloat(0.0)
|
||||
|
||||
var maxFormSize: CGFloat = 0.0
|
||||
|
||||
for entry in entries
|
||||
{
|
||||
let formSize = entry.formSize.isNaN ? self.formSize : entry.formSize
|
||||
if formSize > maxFormSize
|
||||
{
|
||||
maxFormSize = formSize
|
||||
}
|
||||
|
||||
guard let label = entry.label
|
||||
else { continue }
|
||||
|
||||
let size = (label as NSString).size(withAttributes: [.font: font])
|
||||
|
||||
if size.width > maxW
|
||||
{
|
||||
maxW = size.width
|
||||
}
|
||||
if size.height > maxH
|
||||
{
|
||||
maxH = size.height
|
||||
}
|
||||
}
|
||||
|
||||
return CGSize(
|
||||
width: maxW + maxFormSize + formToTextSpace,
|
||||
height: maxH
|
||||
)
|
||||
}
|
||||
|
||||
@objc open var neededWidth = CGFloat(0.0)
|
||||
@objc open var neededHeight = CGFloat(0.0)
|
||||
@objc open var textWidthMax = CGFloat(0.0)
|
||||
@objc open var textHeightMax = CGFloat(0.0)
|
||||
|
||||
/// flag that indicates if word wrapping is enabled
|
||||
/// this is currently supported only for `orientation == Horizontal`.
|
||||
/// you may want to set maxSizePercent when word wrapping, to set the point where the text wraps.
|
||||
///
|
||||
/// **default**: true
|
||||
@objc open var wordWrapEnabled = true
|
||||
|
||||
/// if this is set, then word wrapping the legend is enabled.
|
||||
@objc open var isWordWrapEnabled: Bool { return wordWrapEnabled }
|
||||
|
||||
/// The maximum relative size out of the whole chart view in percent.
|
||||
/// If the legend is to the right/left of the chart, then this affects the width of the legend.
|
||||
/// If the legend is to the top/bottom of the chart, then this affects the height of the legend.
|
||||
///
|
||||
/// **default**: 0.95 (95%)
|
||||
@objc open var maxSizePercent: CGFloat = 0.95
|
||||
|
||||
@objc open func calculateDimensions(labelFont: NSUIFont, viewPortHandler: ViewPortHandler)
|
||||
{
|
||||
let maxEntrySize = getMaximumEntrySize(withFont: labelFont)
|
||||
let defaultFormSize = self.formSize
|
||||
let stackSpace = self.stackSpace
|
||||
let formToTextSpace = self.formToTextSpace
|
||||
let xEntrySpace = self.xEntrySpace
|
||||
let yEntrySpace = self.yEntrySpace
|
||||
let wordWrapEnabled = self.wordWrapEnabled
|
||||
let entries = self.entries
|
||||
let entryCount = entries.count
|
||||
|
||||
textWidthMax = maxEntrySize.width
|
||||
textHeightMax = maxEntrySize.height
|
||||
|
||||
switch orientation
|
||||
{
|
||||
case .vertical:
|
||||
|
||||
var maxWidth = CGFloat(0.0)
|
||||
var width = CGFloat(0.0)
|
||||
var maxHeight = CGFloat(0.0)
|
||||
let labelLineHeight = labelFont.lineHeight
|
||||
|
||||
var wasStacked = false
|
||||
|
||||
for i in 0 ..< entryCount
|
||||
{
|
||||
let e = entries[i]
|
||||
let drawingForm = e.form != .none
|
||||
let formSize = e.formSize.isNaN ? defaultFormSize : e.formSize
|
||||
let label = e.label
|
||||
|
||||
if !wasStacked
|
||||
{
|
||||
width = 0.0
|
||||
}
|
||||
|
||||
if drawingForm
|
||||
{
|
||||
if wasStacked
|
||||
{
|
||||
width += stackSpace
|
||||
}
|
||||
width += formSize
|
||||
}
|
||||
|
||||
if label != nil
|
||||
{
|
||||
let size = (label! as NSString).size(withAttributes: [.font: labelFont])
|
||||
|
||||
if drawingForm && !wasStacked
|
||||
{
|
||||
width += formToTextSpace
|
||||
}
|
||||
else if wasStacked
|
||||
{
|
||||
maxWidth = max(maxWidth, width)
|
||||
maxHeight += labelLineHeight + yEntrySpace
|
||||
width = 0.0
|
||||
wasStacked = false
|
||||
}
|
||||
|
||||
width += size.width
|
||||
|
||||
if i < entryCount - 1
|
||||
{
|
||||
maxHeight += labelLineHeight + yEntrySpace
|
||||
}
|
||||
}
|
||||
else
|
||||
{
|
||||
wasStacked = true
|
||||
width += formSize
|
||||
|
||||
if i < entryCount - 1
|
||||
{
|
||||
width += stackSpace
|
||||
}
|
||||
}
|
||||
|
||||
maxWidth = max(maxWidth, width)
|
||||
}
|
||||
|
||||
neededWidth = maxWidth
|
||||
neededHeight = maxHeight
|
||||
|
||||
case .horizontal:
|
||||
|
||||
let labelLineHeight = labelFont.lineHeight
|
||||
|
||||
let contentWidth: CGFloat = viewPortHandler.contentWidth * maxSizePercent
|
||||
|
||||
// Prepare arrays for calculated layout
|
||||
if calculatedLabelSizes.count != entryCount
|
||||
{
|
||||
calculatedLabelSizes = [CGSize](repeating: CGSize(), count: entryCount)
|
||||
}
|
||||
|
||||
if calculatedLabelBreakPoints.count != entryCount
|
||||
{
|
||||
calculatedLabelBreakPoints = [Bool](repeating: false, count: entryCount)
|
||||
}
|
||||
|
||||
calculatedLineSizes.removeAll(keepingCapacity: true)
|
||||
|
||||
// Start calculating layout
|
||||
|
||||
let labelAttrs = [NSAttributedStringKey.font: labelFont]
|
||||
var maxLineWidth: CGFloat = 0.0
|
||||
var currentLineWidth: CGFloat = 0.0
|
||||
var requiredWidth: CGFloat = 0.0
|
||||
var stackedStartIndex: Int = -1
|
||||
|
||||
for i in 0 ..< entryCount
|
||||
{
|
||||
let e = entries[i]
|
||||
let drawingForm = e.form != .none
|
||||
let label = e.label
|
||||
|
||||
calculatedLabelBreakPoints[i] = false
|
||||
|
||||
if stackedStartIndex == -1
|
||||
{
|
||||
// we are not stacking, so required width is for this label only
|
||||
requiredWidth = 0.0
|
||||
}
|
||||
else
|
||||
{
|
||||
// add the spacing appropriate for stacked labels/forms
|
||||
requiredWidth += stackSpace
|
||||
}
|
||||
|
||||
// grouped forms have null labels
|
||||
if label != nil
|
||||
{
|
||||
calculatedLabelSizes[i] = (label! as NSString).size(withAttributes: labelAttrs)
|
||||
requiredWidth += drawingForm ? formToTextSpace + formSize : 0.0
|
||||
requiredWidth += calculatedLabelSizes[i].width
|
||||
}
|
||||
else
|
||||
{
|
||||
calculatedLabelSizes[i] = CGSize()
|
||||
requiredWidth += drawingForm ? formSize : 0.0
|
||||
|
||||
if stackedStartIndex == -1
|
||||
{
|
||||
// mark this index as we might want to break here later
|
||||
stackedStartIndex = i
|
||||
}
|
||||
}
|
||||
|
||||
if label != nil || i == entryCount - 1
|
||||
{
|
||||
let requiredSpacing = currentLineWidth == 0.0 ? 0.0 : xEntrySpace
|
||||
|
||||
if (!wordWrapEnabled || // No word wrapping, it must fit.
|
||||
currentLineWidth == 0.0 || // The line is empty, it must fit.
|
||||
(contentWidth - currentLineWidth >= requiredSpacing + requiredWidth)) // It simply fits
|
||||
{
|
||||
// Expand current line
|
||||
currentLineWidth += requiredSpacing + requiredWidth
|
||||
}
|
||||
else
|
||||
{ // It doesn't fit, we need to wrap a line
|
||||
|
||||
// Add current line size to array
|
||||
calculatedLineSizes.append(CGSize(width: currentLineWidth, height: labelLineHeight))
|
||||
maxLineWidth = max(maxLineWidth, currentLineWidth)
|
||||
|
||||
// Start a new line
|
||||
calculatedLabelBreakPoints[stackedStartIndex > -1 ? stackedStartIndex : i] = true
|
||||
currentLineWidth = requiredWidth
|
||||
}
|
||||
|
||||
if i == entryCount - 1
|
||||
{ // Add last line size to array
|
||||
calculatedLineSizes.append(CGSize(width: currentLineWidth, height: labelLineHeight))
|
||||
maxLineWidth = max(maxLineWidth, currentLineWidth)
|
||||
}
|
||||
}
|
||||
|
||||
stackedStartIndex = label != nil ? -1 : stackedStartIndex
|
||||
}
|
||||
|
||||
neededWidth = maxLineWidth
|
||||
neededHeight = labelLineHeight * CGFloat(calculatedLineSizes.count) +
|
||||
yEntrySpace * CGFloat(calculatedLineSizes.count == 0 ? 0 : (calculatedLineSizes.count - 1))
|
||||
}
|
||||
|
||||
neededWidth += xOffset
|
||||
neededHeight += yOffset
|
||||
}
|
||||
|
||||
/// MARK: - Custom legend
|
||||
|
||||
/// Sets a custom legend's entries array.
|
||||
/// * A nil label will start a group.
|
||||
/// This will disable the feature that automatically calculates the legend entries from the datasets.
|
||||
/// Call `resetCustom(...)` to re-enable automatic calculation (and then `notifyDataSetChanged()` is needed).
|
||||
@objc open func setCustom(entries: [LegendEntry])
|
||||
{
|
||||
self.entries = entries
|
||||
_isLegendCustom = true
|
||||
}
|
||||
|
||||
/// Calling this will disable the custom legend entries (set by `setLegend(...)`). Instead, the entries will again be calculated automatically (after `notifyDataSetChanged()` is called).
|
||||
@objc open func resetCustom()
|
||||
{
|
||||
_isLegendCustom = false
|
||||
}
|
||||
|
||||
/// **default**: false (automatic legend)
|
||||
/// - returns: `true` if a custom legend entries has been set
|
||||
@objc open var isLegendCustom: Bool
|
||||
{
|
||||
return _isLegendCustom
|
||||
}
|
||||
}
|
||||
91
Pods/Charts/Source/Charts/Components/LegendEntry.swift
generated
Normal file
91
Pods/Charts/Source/Charts/Components/LegendEntry.swift
generated
Normal file
@@ -0,0 +1,91 @@
|
||||
//
|
||||
// LegendEntry.swift
|
||||
// Charts
|
||||
//
|
||||
// Copyright 2015 Daniel Cohen Gindi & Philipp Jahoda
|
||||
// A port of MPAndroidChart for iOS
|
||||
// Licensed under Apache License 2.0
|
||||
//
|
||||
// https://github.com/danielgindi/Charts
|
||||
//
|
||||
|
||||
import Foundation
|
||||
import CoreGraphics
|
||||
|
||||
#if !os(OSX)
|
||||
import UIKit
|
||||
#endif
|
||||
|
||||
@objc(ChartLegendEntry)
|
||||
open class LegendEntry: NSObject
|
||||
{
|
||||
public override init()
|
||||
{
|
||||
super.init()
|
||||
}
|
||||
|
||||
/// - parameter label: The legend entry text.
|
||||
/// A `nil` label will start a group.
|
||||
/// - parameter form: The form to draw for this entry.
|
||||
/// - parameter formSize: Set to NaN to use the legend's default.
|
||||
/// - parameter formLineWidth: Set to NaN to use the legend's default.
|
||||
/// - parameter formLineDashPhase: Line dash configuration.
|
||||
/// - parameter formLineDashLengths: Line dash configurationas NaN to use the legend's default.
|
||||
/// - parameter formColor: The color for drawing the form.
|
||||
@objc public init(label: String?,
|
||||
form: Legend.Form,
|
||||
formSize: CGFloat,
|
||||
formLineWidth: CGFloat,
|
||||
formLineDashPhase: CGFloat,
|
||||
formLineDashLengths: [CGFloat]?,
|
||||
formColor: NSUIColor?)
|
||||
{
|
||||
self.label = label
|
||||
self.form = form
|
||||
self.formSize = formSize
|
||||
self.formLineWidth = formLineWidth
|
||||
self.formLineDashPhase = formLineDashPhase
|
||||
self.formLineDashLengths = formLineDashLengths
|
||||
self.formColor = formColor
|
||||
}
|
||||
|
||||
/// The legend entry text.
|
||||
/// A `nil` label will start a group.
|
||||
@objc open var label: String?
|
||||
|
||||
/// The form to draw for this entry.
|
||||
///
|
||||
/// `None` will avoid drawing a form, and any related space.
|
||||
/// `Empty` will avoid drawing a form, but keep its space.
|
||||
/// `Default` will use the Legend's default.
|
||||
@objc open var form: Legend.Form = .default
|
||||
|
||||
/// Form size will be considered except for when .None is used
|
||||
///
|
||||
/// Set as NaN to use the legend's default
|
||||
@objc open var formSize: CGFloat = CGFloat.nan
|
||||
|
||||
/// Line width used for shapes that consist of lines.
|
||||
///
|
||||
/// Set to NaN to use the legend's default.
|
||||
@objc open var formLineWidth: CGFloat = CGFloat.nan
|
||||
|
||||
/// Line dash configuration for shapes that consist of lines.
|
||||
///
|
||||
/// This is how much (in pixels) into the dash pattern are we starting from.
|
||||
///
|
||||
/// Set to NaN to use the legend's default.
|
||||
@objc open var formLineDashPhase: CGFloat = 0.0
|
||||
|
||||
/// Line dash configuration for shapes that consist of lines.
|
||||
///
|
||||
/// This is the actual dash pattern.
|
||||
/// I.e. [2, 3] will paint [-- -- ]
|
||||
/// [1, 3, 4, 2] will paint [- ---- - ---- ]
|
||||
///
|
||||
/// Set to nil to use the legend's default.
|
||||
@objc open var formLineDashLengths: [CGFloat]?
|
||||
|
||||
/// The color for drawing the form
|
||||
@objc open var formColor: NSUIColor?
|
||||
}
|
||||
110
Pods/Charts/Source/Charts/Components/MarkerImage.swift
generated
Normal file
110
Pods/Charts/Source/Charts/Components/MarkerImage.swift
generated
Normal file
@@ -0,0 +1,110 @@
|
||||
//
|
||||
// ChartMarkerImage.swift
|
||||
// Charts
|
||||
//
|
||||
// Copyright 2015 Daniel Cohen Gindi & Philipp Jahoda
|
||||
// A port of MPAndroidChart for iOS
|
||||
// Licensed under Apache License 2.0
|
||||
//
|
||||
// https://github.com/danielgindi/Charts
|
||||
//
|
||||
|
||||
import Foundation
|
||||
import CoreGraphics
|
||||
|
||||
#if !os(OSX)
|
||||
import UIKit
|
||||
#endif
|
||||
|
||||
@objc(ChartMarkerImage)
|
||||
open class MarkerImage: NSObject, IMarker
|
||||
{
|
||||
/// The marker image to render
|
||||
@objc open var image: NSUIImage?
|
||||
|
||||
open var offset: CGPoint = CGPoint()
|
||||
|
||||
@objc open weak var chartView: ChartViewBase?
|
||||
|
||||
/// As long as size is 0.0/0.0 - it will default to the image's size
|
||||
@objc open var size: CGSize = CGSize()
|
||||
|
||||
public override init()
|
||||
{
|
||||
super.init()
|
||||
}
|
||||
|
||||
open func offsetForDrawing(atPoint point: CGPoint) -> CGPoint
|
||||
{
|
||||
var offset = self.offset
|
||||
|
||||
let chart = self.chartView
|
||||
|
||||
var size = self.size
|
||||
|
||||
if size.width == 0.0 && image != nil
|
||||
{
|
||||
size.width = image?.size.width ?? 0.0
|
||||
}
|
||||
if size.height == 0.0 && image != nil
|
||||
{
|
||||
size.height = image?.size.height ?? 0.0
|
||||
}
|
||||
|
||||
let width = size.width
|
||||
let height = size.height
|
||||
|
||||
if point.x + offset.x < 0.0
|
||||
{
|
||||
offset.x = -point.x
|
||||
}
|
||||
else if chart != nil && point.x + width + offset.x > chart!.bounds.size.width
|
||||
{
|
||||
offset.x = chart!.bounds.size.width - point.x - width
|
||||
}
|
||||
|
||||
if point.y + offset.y < 0
|
||||
{
|
||||
offset.y = -point.y
|
||||
}
|
||||
else if chart != nil && point.y + height + offset.y > chart!.bounds.size.height
|
||||
{
|
||||
offset.y = chart!.bounds.size.height - point.y - height
|
||||
}
|
||||
|
||||
return offset
|
||||
}
|
||||
|
||||
open func refreshContent(entry: ChartDataEntry, highlight: Highlight)
|
||||
{
|
||||
// Do nothing here...
|
||||
}
|
||||
|
||||
open func draw(context: CGContext, point: CGPoint)
|
||||
{
|
||||
guard let image = image else { return }
|
||||
|
||||
let offset = offsetForDrawing(atPoint: point)
|
||||
|
||||
var size = self.size
|
||||
|
||||
if size.width == 0.0
|
||||
{
|
||||
size.width = image.size.width
|
||||
}
|
||||
if size.height == 0.0
|
||||
{
|
||||
size.height = image.size.height
|
||||
}
|
||||
|
||||
let rect = CGRect(
|
||||
x: point.x + offset.x,
|
||||
y: point.y + offset.y,
|
||||
width: size.width,
|
||||
height: size.height)
|
||||
|
||||
NSUIGraphicsPushContext(context)
|
||||
image.draw(in: rect)
|
||||
NSUIGraphicsPopContext()
|
||||
}
|
||||
}
|
||||
99
Pods/Charts/Source/Charts/Components/MarkerView.swift
generated
Normal file
99
Pods/Charts/Source/Charts/Components/MarkerView.swift
generated
Normal file
@@ -0,0 +1,99 @@
|
||||
//
|
||||
// ChartMarkerView.swift
|
||||
// Charts
|
||||
//
|
||||
// Copyright 2015 Daniel Cohen Gindi & Philipp Jahoda
|
||||
// A port of MPAndroidChart for iOS
|
||||
// Licensed under Apache License 2.0
|
||||
//
|
||||
// https://github.com/danielgindi/Charts
|
||||
//
|
||||
|
||||
import Foundation
|
||||
import CoreGraphics
|
||||
|
||||
#if !os(OSX)
|
||||
import UIKit
|
||||
#endif
|
||||
|
||||
@objc(ChartMarkerView)
|
||||
open class MarkerView: NSUIView, IMarker
|
||||
{
|
||||
open var offset: CGPoint = CGPoint()
|
||||
|
||||
@objc open weak var chartView: ChartViewBase?
|
||||
|
||||
open func offsetForDrawing(atPoint point: CGPoint) -> CGPoint
|
||||
{
|
||||
guard let chart = chartView else { return self.offset }
|
||||
|
||||
var offset = self.offset
|
||||
|
||||
let width = self.bounds.size.width
|
||||
let height = self.bounds.size.height
|
||||
|
||||
if point.x + offset.x < 0.0
|
||||
{
|
||||
offset.x = -point.x
|
||||
}
|
||||
else if point.x + width + offset.x > chart.bounds.size.width
|
||||
{
|
||||
offset.x = chart.bounds.size.width - point.x - width
|
||||
}
|
||||
|
||||
if point.y + offset.y < 0
|
||||
{
|
||||
offset.y = -point.y
|
||||
}
|
||||
else if point.y + height + offset.y > chart.bounds.size.height
|
||||
{
|
||||
offset.y = chart.bounds.size.height - point.y - height
|
||||
}
|
||||
|
||||
return offset
|
||||
}
|
||||
|
||||
open func refreshContent(entry: ChartDataEntry, highlight: Highlight)
|
||||
{
|
||||
// Do nothing here...
|
||||
}
|
||||
|
||||
open func draw(context: CGContext, point: CGPoint)
|
||||
{
|
||||
let offset = self.offsetForDrawing(atPoint: point)
|
||||
|
||||
context.saveGState()
|
||||
context.translateBy(x: point.x + offset.x,
|
||||
y: point.y + offset.y)
|
||||
NSUIGraphicsPushContext(context)
|
||||
self.nsuiLayer?.render(in: context)
|
||||
NSUIGraphicsPopContext()
|
||||
context.restoreGState()
|
||||
}
|
||||
|
||||
@objc
|
||||
open class func viewFromXib(in bundle: Bundle = .main) -> MarkerView?
|
||||
{
|
||||
#if !os(OSX)
|
||||
return bundle.loadNibNamed(
|
||||
String(describing: self),
|
||||
owner: nil,
|
||||
options: nil)?[0] as? MarkerView
|
||||
#else
|
||||
|
||||
var loadedObjects = NSArray()
|
||||
let loadedObjectsPointer = AutoreleasingUnsafeMutablePointer<NSArray?>(&loadedObjects)
|
||||
|
||||
if bundle.loadNibNamed(
|
||||
NSNib.Name(String(describing: self)),
|
||||
owner: nil,
|
||||
topLevelObjects: loadedObjectsPointer)
|
||||
{
|
||||
return loadedObjects[0] as? MarkerView
|
||||
}
|
||||
|
||||
return nil
|
||||
#endif
|
||||
}
|
||||
|
||||
}
|
||||
75
Pods/Charts/Source/Charts/Components/XAxis.swift
generated
Normal file
75
Pods/Charts/Source/Charts/Components/XAxis.swift
generated
Normal file
@@ -0,0 +1,75 @@
|
||||
//
|
||||
// XAxis.swift
|
||||
// Charts
|
||||
//
|
||||
// Copyright 2015 Daniel Cohen Gindi & Philipp Jahoda
|
||||
// A port of MPAndroidChart for iOS
|
||||
// Licensed under Apache License 2.0
|
||||
//
|
||||
// https://github.com/danielgindi/Charts
|
||||
//
|
||||
|
||||
import Foundation
|
||||
import CoreGraphics
|
||||
|
||||
@objc(ChartXAxis)
|
||||
open class XAxis: AxisBase
|
||||
{
|
||||
@objc(XAxisLabelPosition)
|
||||
public enum LabelPosition: Int
|
||||
{
|
||||
case top
|
||||
case bottom
|
||||
case bothSided
|
||||
case topInside
|
||||
case bottomInside
|
||||
}
|
||||
|
||||
/// width of the x-axis labels in pixels - this is automatically calculated by the `computeSize()` methods in the renderers
|
||||
@objc open var labelWidth = CGFloat(1.0)
|
||||
|
||||
/// height of the x-axis labels in pixels - this is automatically calculated by the `computeSize()` methods in the renderers
|
||||
@objc open var labelHeight = CGFloat(1.0)
|
||||
|
||||
/// width of the (rotated) x-axis labels in pixels - this is automatically calculated by the `computeSize()` methods in the renderers
|
||||
@objc open var labelRotatedWidth = CGFloat(1.0)
|
||||
|
||||
/// height of the (rotated) x-axis labels in pixels - this is automatically calculated by the `computeSize()` methods in the renderers
|
||||
@objc open var labelRotatedHeight = CGFloat(1.0)
|
||||
|
||||
/// This is the angle for drawing the X axis labels (in degrees)
|
||||
@objc open var labelRotationAngle = CGFloat(0.0)
|
||||
|
||||
/// if set to true, the chart will avoid that the first and last label entry in the chart "clip" off the edge of the chart
|
||||
@objc open var avoidFirstLastClippingEnabled = false
|
||||
|
||||
/// the position of the x-labels relative to the chart
|
||||
@objc open var labelPosition = LabelPosition.top
|
||||
|
||||
/// if set to true, word wrapping the labels will be enabled.
|
||||
/// word wrapping is done using `(value width * labelRotatedWidth)`
|
||||
///
|
||||
/// - note: currently supports all charts except pie/radar/horizontal-bar*
|
||||
@objc open var wordWrapEnabled = false
|
||||
|
||||
/// - returns: `true` if word wrapping the labels is enabled
|
||||
@objc open var isWordWrapEnabled: Bool { return wordWrapEnabled }
|
||||
|
||||
/// the width for wrapping the labels, as percentage out of one value width.
|
||||
/// used only when isWordWrapEnabled = true.
|
||||
///
|
||||
/// **default**: 1.0
|
||||
@objc open var wordWrapWidthPercent: CGFloat = 1.0
|
||||
|
||||
public override init()
|
||||
{
|
||||
super.init()
|
||||
|
||||
self.yOffset = 4.0
|
||||
}
|
||||
|
||||
@objc open var isAvoidFirstLastClippingEnabled: Bool
|
||||
{
|
||||
return avoidFirstLastClippingEnabled
|
||||
}
|
||||
}
|
||||
179
Pods/Charts/Source/Charts/Components/YAxis.swift
generated
Normal file
179
Pods/Charts/Source/Charts/Components/YAxis.swift
generated
Normal file
@@ -0,0 +1,179 @@
|
||||
//
|
||||
// YAxis.swift
|
||||
// Charts
|
||||
//
|
||||
// Copyright 2015 Daniel Cohen Gindi & Philipp Jahoda
|
||||
// A port of MPAndroidChart for iOS
|
||||
// Licensed under Apache License 2.0
|
||||
//
|
||||
// https://github.com/danielgindi/Charts
|
||||
//
|
||||
|
||||
import Foundation
|
||||
import CoreGraphics
|
||||
|
||||
#if !os(OSX)
|
||||
import UIKit
|
||||
#endif
|
||||
|
||||
|
||||
/// Class representing the y-axis labels settings and its entries.
|
||||
/// Be aware that not all features the YLabels class provides are suitable for the RadarChart.
|
||||
/// Customizations that affect the value range of the axis need to be applied before setting data for the chart.
|
||||
@objc(ChartYAxis)
|
||||
open class YAxis: AxisBase
|
||||
{
|
||||
@objc(YAxisLabelPosition)
|
||||
public enum LabelPosition: Int
|
||||
{
|
||||
case outsideChart
|
||||
case insideChart
|
||||
}
|
||||
|
||||
/// Enum that specifies the axis a DataSet should be plotted against, either Left or Right.
|
||||
@objc
|
||||
public enum AxisDependency: Int
|
||||
{
|
||||
case left
|
||||
case right
|
||||
}
|
||||
|
||||
/// indicates if the bottom y-label entry is drawn or not
|
||||
@objc open var drawBottomYLabelEntryEnabled = true
|
||||
|
||||
/// indicates if the top y-label entry is drawn or not
|
||||
@objc open var drawTopYLabelEntryEnabled = true
|
||||
|
||||
/// flag that indicates if the axis is inverted or not
|
||||
@objc open var inverted = false
|
||||
|
||||
/// flag that indicates if the zero-line should be drawn regardless of other grid lines
|
||||
@objc open var drawZeroLineEnabled = false
|
||||
|
||||
/// Color of the zero line
|
||||
@objc open var zeroLineColor: NSUIColor? = NSUIColor.gray
|
||||
|
||||
/// Width of the zero line
|
||||
@objc open var zeroLineWidth: CGFloat = 1.0
|
||||
|
||||
/// This is how much (in pixels) into the dash pattern are we starting from.
|
||||
@objc open var zeroLineDashPhase = CGFloat(0.0)
|
||||
|
||||
/// This is the actual dash pattern.
|
||||
/// I.e. [2, 3] will paint [-- -- ]
|
||||
/// [1, 3, 4, 2] will paint [- ---- - ---- ]
|
||||
@objc open var zeroLineDashLengths: [CGFloat]?
|
||||
|
||||
/// axis space from the largest value to the top in percent of the total axis range
|
||||
@objc open var spaceTop = CGFloat(0.1)
|
||||
|
||||
/// axis space from the smallest value to the bottom in percent of the total axis range
|
||||
@objc open var spaceBottom = CGFloat(0.1)
|
||||
|
||||
/// the position of the y-labels relative to the chart
|
||||
@objc open var labelPosition = LabelPosition.outsideChart
|
||||
|
||||
/// the side this axis object represents
|
||||
private var _axisDependency = AxisDependency.left
|
||||
|
||||
/// the minimum width that the axis should take
|
||||
///
|
||||
/// **default**: 0.0
|
||||
@objc open var minWidth = CGFloat(0)
|
||||
|
||||
/// the maximum width that the axis can take.
|
||||
/// use Infinity for disabling the maximum.
|
||||
///
|
||||
/// **default**: CGFloat.infinity
|
||||
@objc open var maxWidth = CGFloat(CGFloat.infinity)
|
||||
|
||||
public override init()
|
||||
{
|
||||
super.init()
|
||||
|
||||
self.yOffset = 0.0
|
||||
}
|
||||
|
||||
@objc public init(position: AxisDependency)
|
||||
{
|
||||
super.init()
|
||||
|
||||
_axisDependency = position
|
||||
|
||||
self.yOffset = 0.0
|
||||
}
|
||||
|
||||
@objc open var axisDependency: AxisDependency
|
||||
{
|
||||
return _axisDependency
|
||||
}
|
||||
|
||||
@objc open func requiredSize() -> CGSize
|
||||
{
|
||||
let label = getLongestLabel() as NSString
|
||||
var size = label.size(withAttributes: [NSAttributedStringKey.font: labelFont])
|
||||
size.width += xOffset * 2.0
|
||||
size.height += yOffset * 2.0
|
||||
size.width = max(minWidth, min(size.width, maxWidth > 0.0 ? maxWidth : size.width))
|
||||
return size
|
||||
}
|
||||
|
||||
@objc open func getRequiredHeightSpace() -> CGFloat
|
||||
{
|
||||
return requiredSize().height
|
||||
}
|
||||
|
||||
/// - returns: `true` if this axis needs horizontal offset, `false` ifno offset is needed.
|
||||
@objc open var needsOffset: Bool
|
||||
{
|
||||
if isEnabled && isDrawLabelsEnabled && labelPosition == .outsideChart
|
||||
{
|
||||
return true
|
||||
}
|
||||
else
|
||||
{
|
||||
return false
|
||||
}
|
||||
}
|
||||
|
||||
@objc open var isInverted: Bool { return inverted }
|
||||
|
||||
open override func calculate(min dataMin: Double, max dataMax: Double)
|
||||
{
|
||||
// if custom, use value as is, else use data value
|
||||
var min = _customAxisMin ? _axisMinimum : dataMin
|
||||
var max = _customAxisMax ? _axisMaximum : dataMax
|
||||
|
||||
// temporary range (before calculations)
|
||||
let range = abs(max - min)
|
||||
|
||||
// in case all values are equal
|
||||
if range == 0.0
|
||||
{
|
||||
max = max + 1.0
|
||||
min = min - 1.0
|
||||
}
|
||||
|
||||
// bottom-space only effects non-custom min
|
||||
if !_customAxisMin
|
||||
{
|
||||
let bottomSpace = range * Double(spaceBottom)
|
||||
_axisMinimum = (min - bottomSpace)
|
||||
}
|
||||
|
||||
// top-space only effects non-custom max
|
||||
if !_customAxisMax
|
||||
{
|
||||
let topSpace = range * Double(spaceTop)
|
||||
_axisMaximum = (max + topSpace)
|
||||
}
|
||||
|
||||
// calc actual range
|
||||
axisRange = abs(_axisMaximum - _axisMinimum)
|
||||
}
|
||||
|
||||
@objc open var isDrawBottomYLabelEntryEnabled: Bool { return drawBottomYLabelEntryEnabled }
|
||||
|
||||
@objc open var isDrawTopYLabelEntryEnabled: Bool { return drawTopYLabelEntryEnabled }
|
||||
|
||||
}
|
||||
424
Pods/Charts/Source/Charts/Data/Implementations/ChartBaseDataSet.swift
generated
Normal file
424
Pods/Charts/Source/Charts/Data/Implementations/ChartBaseDataSet.swift
generated
Normal file
@@ -0,0 +1,424 @@
|
||||
//
|
||||
// BaseDataSet.swift
|
||||
// Charts
|
||||
//
|
||||
// Copyright 2015 Daniel Cohen Gindi & Philipp Jahoda
|
||||
// A port of MPAndroidChart for iOS
|
||||
// Licensed under Apache License 2.0
|
||||
//
|
||||
// https://github.com/danielgindi/Charts
|
||||
//
|
||||
|
||||
import Foundation
|
||||
import CoreGraphics
|
||||
|
||||
|
||||
open class ChartBaseDataSet: NSObject, IChartDataSet
|
||||
{
|
||||
public required override init()
|
||||
{
|
||||
super.init()
|
||||
|
||||
// default color
|
||||
colors.append(NSUIColor(red: 140.0/255.0, green: 234.0/255.0, blue: 255.0/255.0, alpha: 1.0))
|
||||
valueColors.append(NSUIColor.black)
|
||||
}
|
||||
|
||||
@objc public init(label: String?)
|
||||
{
|
||||
super.init()
|
||||
|
||||
// default color
|
||||
colors.append(NSUIColor(red: 140.0/255.0, green: 234.0/255.0, blue: 255.0/255.0, alpha: 1.0))
|
||||
valueColors.append(NSUIColor.black)
|
||||
|
||||
self.label = label
|
||||
}
|
||||
|
||||
// MARK: - Data functions and accessors
|
||||
|
||||
/// Use this method to tell the data set that the underlying data has changed
|
||||
open func notifyDataSetChanged()
|
||||
{
|
||||
calcMinMax()
|
||||
}
|
||||
|
||||
open func calcMinMax()
|
||||
{
|
||||
fatalError("calcMinMax is not implemented in ChartBaseDataSet")
|
||||
}
|
||||
|
||||
open func calcMinMaxY(fromX: Double, toX: Double)
|
||||
{
|
||||
fatalError("calcMinMaxY(fromX:, toX:) is not implemented in ChartBaseDataSet")
|
||||
}
|
||||
|
||||
open var yMin: Double
|
||||
{
|
||||
fatalError("yMin is not implemented in ChartBaseDataSet")
|
||||
}
|
||||
|
||||
open var yMax: Double
|
||||
{
|
||||
fatalError("yMax is not implemented in ChartBaseDataSet")
|
||||
}
|
||||
|
||||
open var xMin: Double
|
||||
{
|
||||
fatalError("xMin is not implemented in ChartBaseDataSet")
|
||||
}
|
||||
|
||||
open var xMax: Double
|
||||
{
|
||||
fatalError("xMax is not implemented in ChartBaseDataSet")
|
||||
}
|
||||
|
||||
open var entryCount: Int
|
||||
{
|
||||
fatalError("entryCount is not implemented in ChartBaseDataSet")
|
||||
}
|
||||
|
||||
open func entryForIndex(_ i: Int) -> ChartDataEntry?
|
||||
{
|
||||
fatalError("entryForIndex is not implemented in ChartBaseDataSet")
|
||||
}
|
||||
|
||||
open func entryForXValue(
|
||||
_ x: Double,
|
||||
closestToY y: Double,
|
||||
rounding: ChartDataSetRounding) -> ChartDataEntry?
|
||||
{
|
||||
fatalError("entryForXValue(x, closestToY, rounding) is not implemented in ChartBaseDataSet")
|
||||
}
|
||||
|
||||
open func entryForXValue(
|
||||
_ x: Double,
|
||||
closestToY y: Double) -> ChartDataEntry?
|
||||
{
|
||||
fatalError("entryForXValue(x, closestToY) is not implemented in ChartBaseDataSet")
|
||||
}
|
||||
|
||||
open func entriesForXValue(_ x: Double) -> [ChartDataEntry]
|
||||
{
|
||||
fatalError("entriesForXValue is not implemented in ChartBaseDataSet")
|
||||
}
|
||||
|
||||
open func entryIndex(
|
||||
x xValue: Double,
|
||||
closestToY y: Double,
|
||||
rounding: ChartDataSetRounding) -> Int
|
||||
{
|
||||
fatalError("entryIndex(x, closestToY, rounding) is not implemented in ChartBaseDataSet")
|
||||
}
|
||||
|
||||
open func entryIndex(entry e: ChartDataEntry) -> Int
|
||||
{
|
||||
fatalError("entryIndex(entry) is not implemented in ChartBaseDataSet")
|
||||
}
|
||||
|
||||
open func addEntry(_ e: ChartDataEntry) -> Bool
|
||||
{
|
||||
fatalError("addEntry is not implemented in ChartBaseDataSet")
|
||||
}
|
||||
|
||||
open func addEntryOrdered(_ e: ChartDataEntry) -> Bool
|
||||
{
|
||||
fatalError("addEntryOrdered is not implemented in ChartBaseDataSet")
|
||||
}
|
||||
|
||||
@discardableResult open func removeEntry(_ entry: ChartDataEntry) -> Bool
|
||||
{
|
||||
fatalError("removeEntry is not implemented in ChartBaseDataSet")
|
||||
}
|
||||
|
||||
@discardableResult open func removeEntry(index: Int) -> Bool
|
||||
{
|
||||
if let entry = entryForIndex(index)
|
||||
{
|
||||
return removeEntry(entry)
|
||||
}
|
||||
return false
|
||||
}
|
||||
|
||||
@discardableResult open func removeEntry(x: Double) -> Bool
|
||||
{
|
||||
if let entry = entryForXValue(x, closestToY: Double.nan)
|
||||
{
|
||||
return removeEntry(entry)
|
||||
}
|
||||
return false
|
||||
}
|
||||
|
||||
@discardableResult open func removeFirst() -> Bool
|
||||
{
|
||||
if entryCount > 0
|
||||
{
|
||||
if let entry = entryForIndex(0)
|
||||
{
|
||||
return removeEntry(entry)
|
||||
}
|
||||
}
|
||||
return false
|
||||
}
|
||||
|
||||
@discardableResult open func removeLast() -> Bool
|
||||
{
|
||||
if entryCount > 0
|
||||
{
|
||||
if let entry = entryForIndex(entryCount - 1)
|
||||
{
|
||||
return removeEntry(entry)
|
||||
}
|
||||
}
|
||||
return false
|
||||
}
|
||||
|
||||
open func contains(_ e: ChartDataEntry) -> Bool
|
||||
{
|
||||
fatalError("removeEntry is not implemented in ChartBaseDataSet")
|
||||
}
|
||||
|
||||
open func clear()
|
||||
{
|
||||
fatalError("clear is not implemented in ChartBaseDataSet")
|
||||
}
|
||||
|
||||
// MARK: - Styling functions and accessors
|
||||
|
||||
/// All the colors that are used for this DataSet.
|
||||
/// Colors are reused as soon as the number of Entries the DataSet represents is higher than the size of the colors array.
|
||||
open var colors = [NSUIColor]()
|
||||
|
||||
/// List representing all colors that are used for drawing the actual values for this DataSet
|
||||
open var valueColors = [NSUIColor]()
|
||||
|
||||
/// The label string that describes the DataSet.
|
||||
open var label: String? = "DataSet"
|
||||
|
||||
/// The axis this DataSet should be plotted against.
|
||||
open var axisDependency = YAxis.AxisDependency.left
|
||||
|
||||
/// - returns: The color at the given index of the DataSet's color array.
|
||||
/// This prevents out-of-bounds by performing a modulus on the color index, so colours will repeat themselves.
|
||||
open func color(atIndex index: Int) -> NSUIColor
|
||||
{
|
||||
var index = index
|
||||
if index < 0
|
||||
{
|
||||
index = 0
|
||||
}
|
||||
return colors[index % colors.count]
|
||||
}
|
||||
|
||||
/// Resets all colors of this DataSet and recreates the colors array.
|
||||
open func resetColors()
|
||||
{
|
||||
colors.removeAll(keepingCapacity: false)
|
||||
}
|
||||
|
||||
/// Adds a new color to the colors array of the DataSet.
|
||||
/// - parameter color: the color to add
|
||||
open func addColor(_ color: NSUIColor)
|
||||
{
|
||||
colors.append(color)
|
||||
}
|
||||
|
||||
/// Sets the one and **only** color that should be used for this DataSet.
|
||||
/// Internally, this recreates the colors array and adds the specified color.
|
||||
/// - parameter color: the color to set
|
||||
open func setColor(_ color: NSUIColor)
|
||||
{
|
||||
colors.removeAll(keepingCapacity: false)
|
||||
colors.append(color)
|
||||
}
|
||||
|
||||
/// Sets colors to a single color a specific alpha value.
|
||||
/// - parameter color: the color to set
|
||||
/// - parameter alpha: alpha to apply to the set `color`
|
||||
@objc open func setColor(_ color: NSUIColor, alpha: CGFloat)
|
||||
{
|
||||
setColor(color.withAlphaComponent(alpha))
|
||||
}
|
||||
|
||||
/// Sets colors with a specific alpha value.
|
||||
/// - parameter colors: the colors to set
|
||||
/// - parameter alpha: alpha to apply to the set `colors`
|
||||
@objc open func setColors(_ colors: [NSUIColor], alpha: CGFloat)
|
||||
{
|
||||
var colorsWithAlpha = colors
|
||||
|
||||
for i in 0 ..< colorsWithAlpha.count
|
||||
{
|
||||
colorsWithAlpha[i] = colorsWithAlpha[i] .withAlphaComponent(alpha)
|
||||
}
|
||||
|
||||
self.colors = colorsWithAlpha
|
||||
}
|
||||
|
||||
/// Sets colors with a specific alpha value.
|
||||
/// - parameter colors: the colors to set
|
||||
/// - parameter alpha: alpha to apply to the set `colors`
|
||||
open func setColors(_ colors: NSUIColor...)
|
||||
{
|
||||
self.colors = colors
|
||||
}
|
||||
|
||||
/// if true, value highlighting is enabled
|
||||
open var highlightEnabled = true
|
||||
|
||||
/// - returns: `true` if value highlighting is enabled for this dataset
|
||||
open var isHighlightEnabled: Bool { return highlightEnabled }
|
||||
|
||||
/// Custom formatter that is used instead of the auto-formatter if set
|
||||
internal var _valueFormatter: IValueFormatter?
|
||||
|
||||
/// Custom formatter that is used instead of the auto-formatter if set
|
||||
open var valueFormatter: IValueFormatter?
|
||||
{
|
||||
get
|
||||
{
|
||||
if needsFormatter
|
||||
{
|
||||
return ChartUtils.defaultValueFormatter()
|
||||
}
|
||||
|
||||
return _valueFormatter
|
||||
}
|
||||
set
|
||||
{
|
||||
if newValue == nil { return }
|
||||
|
||||
_valueFormatter = newValue
|
||||
}
|
||||
}
|
||||
|
||||
open var needsFormatter: Bool
|
||||
{
|
||||
return _valueFormatter == nil
|
||||
}
|
||||
|
||||
/// Sets/get a single color for value text.
|
||||
/// Setting the color clears the colors array and adds a single color.
|
||||
/// Getting will return the first color in the array.
|
||||
open var valueTextColor: NSUIColor
|
||||
{
|
||||
get
|
||||
{
|
||||
return valueColors[0]
|
||||
}
|
||||
set
|
||||
{
|
||||
valueColors.removeAll(keepingCapacity: false)
|
||||
valueColors.append(newValue)
|
||||
}
|
||||
}
|
||||
|
||||
/// - returns: The color at the specified index that is used for drawing the values inside the chart. Uses modulus internally.
|
||||
open func valueTextColorAt(_ index: Int) -> NSUIColor
|
||||
{
|
||||
var index = index
|
||||
if index < 0
|
||||
{
|
||||
index = 0
|
||||
}
|
||||
return valueColors[index % valueColors.count]
|
||||
}
|
||||
|
||||
/// the font for the value-text labels
|
||||
open var valueFont: NSUIFont = NSUIFont.systemFont(ofSize: 7.0)
|
||||
|
||||
/// The form to draw for this dataset in the legend.
|
||||
open var form = Legend.Form.default
|
||||
|
||||
/// The form size to draw for this dataset in the legend.
|
||||
///
|
||||
/// Return `NaN` to use the default legend form size.
|
||||
open var formSize: CGFloat = CGFloat.nan
|
||||
|
||||
/// The line width for drawing the form of this dataset in the legend
|
||||
///
|
||||
/// Return `NaN` to use the default legend form line width.
|
||||
open var formLineWidth: CGFloat = CGFloat.nan
|
||||
|
||||
/// Line dash configuration for legend shapes that consist of lines.
|
||||
///
|
||||
/// This is how much (in pixels) into the dash pattern are we starting from.
|
||||
open var formLineDashPhase: CGFloat = 0.0
|
||||
|
||||
/// Line dash configuration for legend shapes that consist of lines.
|
||||
///
|
||||
/// This is the actual dash pattern.
|
||||
/// I.e. [2, 3] will paint [-- -- ]
|
||||
/// [1, 3, 4, 2] will paint [- ---- - ---- ]
|
||||
open var formLineDashLengths: [CGFloat]? = nil
|
||||
|
||||
/// Set this to true to draw y-values on the chart.
|
||||
///
|
||||
/// - note: For bar and line charts: if `maxVisibleCount` is reached, no values will be drawn even if this is enabled.
|
||||
open var drawValuesEnabled = true
|
||||
|
||||
/// - returns: `true` if y-value drawing is enabled, `false` ifnot
|
||||
open var isDrawValuesEnabled: Bool
|
||||
{
|
||||
return drawValuesEnabled
|
||||
}
|
||||
|
||||
/// Set this to true to draw y-icons on the chart.
|
||||
///
|
||||
/// - note: For bar and line charts: if `maxVisibleCount` is reached, no icons will be drawn even if this is enabled.
|
||||
open var drawIconsEnabled = true
|
||||
|
||||
/// Returns true if y-icon drawing is enabled, false if not
|
||||
open var isDrawIconsEnabled: Bool
|
||||
{
|
||||
return drawIconsEnabled
|
||||
}
|
||||
|
||||
/// Offset of icons drawn on the chart.
|
||||
///
|
||||
/// For all charts except Pie and Radar it will be ordinary (x offset, y offset).
|
||||
///
|
||||
/// For Pie and Radar chart it will be (y offset, distance from center offset); so if you want icon to be rendered under value, you should increase X component of CGPoint, and if you want icon to be rendered closet to center, you should decrease height component of CGPoint.
|
||||
open var iconsOffset = CGPoint(x: 0, y: 0)
|
||||
|
||||
/// Set the visibility of this DataSet. If not visible, the DataSet will not be drawn to the chart upon refreshing it.
|
||||
open var visible = true
|
||||
|
||||
/// - returns: `true` if this DataSet is visible inside the chart, or `false` ifit is currently hidden.
|
||||
open var isVisible: Bool
|
||||
{
|
||||
return visible
|
||||
}
|
||||
|
||||
// MARK: - NSObject
|
||||
|
||||
open override var description: String
|
||||
{
|
||||
return String(format: "%@, label: %@, %i entries", arguments: [NSStringFromClass(type(of: self)), self.label ?? "", self.entryCount])
|
||||
}
|
||||
|
||||
open override var debugDescription: String
|
||||
{
|
||||
var desc = description + ":"
|
||||
|
||||
for i in 0 ..< self.entryCount
|
||||
{
|
||||
desc += "\n" + (self.entryForIndex(i)?.description ?? "")
|
||||
}
|
||||
|
||||
return desc
|
||||
}
|
||||
|
||||
// MARK: - NSCopying
|
||||
|
||||
@objc open func copyWithZone(_ zone: NSZone?) -> AnyObject
|
||||
{
|
||||
let copy = type(of: self).init()
|
||||
|
||||
copy.colors = colors
|
||||
copy.valueColors = valueColors
|
||||
copy.label = label
|
||||
|
||||
return copy
|
||||
}
|
||||
}
|
||||
105
Pods/Charts/Source/Charts/Data/Implementations/Standard/BarChartData.swift
generated
Normal file
105
Pods/Charts/Source/Charts/Data/Implementations/Standard/BarChartData.swift
generated
Normal file
@@ -0,0 +1,105 @@
|
||||
//
|
||||
// BarChartData.swift
|
||||
// Charts
|
||||
//
|
||||
// Copyright 2015 Daniel Cohen Gindi & Philipp Jahoda
|
||||
// A port of MPAndroidChart for iOS
|
||||
// Licensed under Apache License 2.0
|
||||
//
|
||||
// https://github.com/danielgindi/Charts
|
||||
//
|
||||
|
||||
import Foundation
|
||||
import CoreGraphics
|
||||
|
||||
open class BarChartData: BarLineScatterCandleBubbleChartData
|
||||
{
|
||||
public override init()
|
||||
{
|
||||
super.init()
|
||||
}
|
||||
|
||||
public override init(dataSets: [IChartDataSet]?)
|
||||
{
|
||||
super.init(dataSets: dataSets)
|
||||
}
|
||||
|
||||
/// The width of the bars on the x-axis, in values (not pixels)
|
||||
///
|
||||
/// **default**: 0.85
|
||||
@objc open var barWidth = Double(0.85)
|
||||
|
||||
/// Groups all BarDataSet objects this data object holds together by modifying the x-value of their entries.
|
||||
/// Previously set x-values of entries will be overwritten. Leaves space between bars and groups as specified by the parameters.
|
||||
/// Do not forget to call notifyDataSetChanged() on your BarChart object after calling this method.
|
||||
///
|
||||
/// - parameter the starting point on the x-axis where the grouping should begin
|
||||
/// - parameter groupSpace: The space between groups of bars in values (not pixels) e.g. 0.8f for bar width 1f
|
||||
/// - parameter barSpace: The space between individual bars in values (not pixels) e.g. 0.1f for bar width 1f
|
||||
@objc open func groupBars(fromX: Double, groupSpace: Double, barSpace: Double)
|
||||
{
|
||||
let setCount = _dataSets.count
|
||||
if setCount <= 1
|
||||
{
|
||||
print("BarData needs to hold at least 2 BarDataSets to allow grouping.", terminator: "\n")
|
||||
return
|
||||
}
|
||||
|
||||
let max = maxEntryCountSet
|
||||
let maxEntryCount = max?.entryCount ?? 0
|
||||
|
||||
let groupSpaceWidthHalf = groupSpace / 2.0
|
||||
let barSpaceHalf = barSpace / 2.0
|
||||
let barWidthHalf = self.barWidth / 2.0
|
||||
|
||||
var fromX = fromX
|
||||
|
||||
let interval = groupWidth(groupSpace: groupSpace, barSpace: barSpace)
|
||||
|
||||
for i in stride(from: 0, to: maxEntryCount, by: 1)
|
||||
{
|
||||
let start = fromX
|
||||
fromX += groupSpaceWidthHalf
|
||||
|
||||
(_dataSets as? [IBarChartDataSet])?.forEach { set in
|
||||
fromX += barSpaceHalf
|
||||
fromX += barWidthHalf
|
||||
|
||||
if i < set.entryCount
|
||||
{
|
||||
if let entry = set.entryForIndex(i)
|
||||
{
|
||||
entry.x = fromX
|
||||
}
|
||||
}
|
||||
|
||||
fromX += barWidthHalf
|
||||
fromX += barSpaceHalf
|
||||
}
|
||||
|
||||
fromX += groupSpaceWidthHalf
|
||||
let end = fromX
|
||||
let innerInterval = end - start
|
||||
let diff = interval - innerInterval
|
||||
|
||||
// correct rounding errors
|
||||
if diff > 0 || diff < 0
|
||||
{
|
||||
fromX += diff
|
||||
}
|
||||
|
||||
}
|
||||
|
||||
notifyDataChanged()
|
||||
}
|
||||
|
||||
/// In case of grouped bars, this method returns the space an individual group of bar needs on the x-axis.
|
||||
///
|
||||
/// - parameter groupSpace:
|
||||
/// - parameter barSpace:
|
||||
@objc open func groupWidth(groupSpace: Double, barSpace: Double) -> Double
|
||||
{
|
||||
return Double(_dataSets.count) * (self.barWidth + barSpace) + groupSpace
|
||||
}
|
||||
|
||||
}
|
||||
247
Pods/Charts/Source/Charts/Data/Implementations/Standard/BarChartDataEntry.swift
generated
Normal file
247
Pods/Charts/Source/Charts/Data/Implementations/Standard/BarChartDataEntry.swift
generated
Normal file
@@ -0,0 +1,247 @@
|
||||
//
|
||||
// BarChartDataEntry.swift
|
||||
// Charts
|
||||
//
|
||||
// Copyright 2015 Daniel Cohen Gindi & Philipp Jahoda
|
||||
// A port of MPAndroidChart for iOS
|
||||
// Licensed under Apache License 2.0
|
||||
//
|
||||
// https://github.com/danielgindi/Charts
|
||||
//
|
||||
|
||||
import Foundation
|
||||
|
||||
open class BarChartDataEntry: ChartDataEntry
|
||||
{
|
||||
/// the values the stacked barchart holds
|
||||
private var _yVals: [Double]?
|
||||
|
||||
/// the ranges for the individual stack values - automatically calculated
|
||||
private var _ranges: [Range]?
|
||||
|
||||
/// the sum of all negative values this entry (if stacked) contains
|
||||
private var _negativeSum: Double = 0.0
|
||||
|
||||
/// the sum of all positive values this entry (if stacked) contains
|
||||
private var _positiveSum: Double = 0.0
|
||||
|
||||
public required init()
|
||||
{
|
||||
super.init()
|
||||
}
|
||||
|
||||
/// Constructor for normal bars (not stacked).
|
||||
public override init(x: Double, y: Double)
|
||||
{
|
||||
super.init(x: x, y: y)
|
||||
}
|
||||
|
||||
/// Constructor for normal bars (not stacked).
|
||||
public override init(x: Double, y: Double, data: AnyObject?)
|
||||
{
|
||||
super.init(x: x, y: y, data: data)
|
||||
}
|
||||
|
||||
/// Constructor for normal bars (not stacked).
|
||||
public override init(x: Double, y: Double, icon: NSUIImage?)
|
||||
{
|
||||
super.init(x: x, y: y, icon: icon)
|
||||
}
|
||||
|
||||
/// Constructor for normal bars (not stacked).
|
||||
public override init(x: Double, y: Double, icon: NSUIImage?, data: AnyObject?)
|
||||
{
|
||||
super.init(x: x, y: y, icon: icon, data: data)
|
||||
}
|
||||
|
||||
/// Constructor for stacked bar entries.
|
||||
@objc public init(x: Double, yValues: [Double])
|
||||
{
|
||||
super.init(x: x, y: BarChartDataEntry.calcSum(values: yValues))
|
||||
self._yVals = yValues
|
||||
calcPosNegSum()
|
||||
calcRanges()
|
||||
}
|
||||
|
||||
/// Constructor for stacked bar entries. One data object for whole stack
|
||||
@objc public init(x: Double, yValues: [Double], data: AnyObject?)
|
||||
{
|
||||
super.init(x: x, y: BarChartDataEntry.calcSum(values: yValues), data: data)
|
||||
self._yVals = yValues
|
||||
calcPosNegSum()
|
||||
calcRanges()
|
||||
}
|
||||
|
||||
/// Constructor for stacked bar entries. One data object for whole stack
|
||||
@objc public init(x: Double, yValues: [Double], icon: NSUIImage?, data: AnyObject?)
|
||||
{
|
||||
super.init(x: x, y: BarChartDataEntry.calcSum(values: yValues), icon: icon, data: data)
|
||||
self._yVals = yValues
|
||||
calcPosNegSum()
|
||||
calcRanges()
|
||||
}
|
||||
|
||||
/// Constructor for stacked bar entries. One data object for whole stack
|
||||
@objc public init(x: Double, yValues: [Double], icon: NSUIImage?)
|
||||
{
|
||||
super.init(x: x, y: BarChartDataEntry.calcSum(values: yValues), icon: icon)
|
||||
self._yVals = yValues
|
||||
calcPosNegSum()
|
||||
calcRanges()
|
||||
}
|
||||
|
||||
@objc open func sumBelow(stackIndex :Int) -> Double
|
||||
{
|
||||
guard let yVals = _yVals else
|
||||
{
|
||||
return 0
|
||||
}
|
||||
|
||||
var remainder: Double = 0.0
|
||||
var index = yVals.count - 1
|
||||
|
||||
while (index > stackIndex && index >= 0)
|
||||
{
|
||||
remainder += yVals[index]
|
||||
index -= 1
|
||||
}
|
||||
|
||||
return remainder
|
||||
}
|
||||
|
||||
/// - returns: The sum of all negative values this entry (if stacked) contains. (this is a positive number)
|
||||
@objc open var negativeSum: Double
|
||||
{
|
||||
return _negativeSum
|
||||
}
|
||||
|
||||
/// - returns: The sum of all positive values this entry (if stacked) contains.
|
||||
@objc open var positiveSum: Double
|
||||
{
|
||||
return _positiveSum
|
||||
}
|
||||
|
||||
@objc open func calcPosNegSum()
|
||||
{
|
||||
guard let _yVals = _yVals else
|
||||
{
|
||||
_positiveSum = 0.0
|
||||
_negativeSum = 0.0
|
||||
return
|
||||
}
|
||||
|
||||
var sumNeg: Double = 0.0
|
||||
var sumPos: Double = 0.0
|
||||
|
||||
for f in _yVals
|
||||
{
|
||||
if f < 0.0
|
||||
{
|
||||
sumNeg += -f
|
||||
}
|
||||
else
|
||||
{
|
||||
sumPos += f
|
||||
}
|
||||
}
|
||||
|
||||
_negativeSum = sumNeg
|
||||
_positiveSum = sumPos
|
||||
}
|
||||
|
||||
/// Splits up the stack-values of the given bar-entry into Range objects.
|
||||
/// - parameter entry:
|
||||
/// - returns:
|
||||
@objc open func calcRanges()
|
||||
{
|
||||
let values = yValues
|
||||
if values?.isEmpty != false
|
||||
{
|
||||
return
|
||||
}
|
||||
|
||||
if _ranges == nil
|
||||
{
|
||||
_ranges = [Range]()
|
||||
}
|
||||
else
|
||||
{
|
||||
_ranges?.removeAll()
|
||||
}
|
||||
|
||||
_ranges?.reserveCapacity(values!.count)
|
||||
|
||||
var negRemain = -negativeSum
|
||||
var posRemain: Double = 0.0
|
||||
|
||||
for i in 0 ..< values!.count
|
||||
{
|
||||
let value = values![i]
|
||||
|
||||
if value < 0
|
||||
{
|
||||
_ranges?.append(Range(from: negRemain, to: negRemain - value))
|
||||
negRemain -= value
|
||||
}
|
||||
else
|
||||
{
|
||||
_ranges?.append(Range(from: posRemain, to: posRemain + value))
|
||||
posRemain += value
|
||||
}
|
||||
}
|
||||
}
|
||||
|
||||
// MARK: Accessors
|
||||
|
||||
/// the values the stacked barchart holds
|
||||
@objc open var isStacked: Bool { return _yVals != nil }
|
||||
|
||||
/// the values the stacked barchart holds
|
||||
@objc open var yValues: [Double]?
|
||||
{
|
||||
get { return self._yVals }
|
||||
set
|
||||
{
|
||||
self.y = BarChartDataEntry.calcSum(values: newValue)
|
||||
self._yVals = newValue
|
||||
calcPosNegSum()
|
||||
calcRanges()
|
||||
}
|
||||
}
|
||||
|
||||
/// - returns: The ranges of the individual stack-entries. Will return null if this entry is not stacked.
|
||||
@objc open var ranges: [Range]?
|
||||
{
|
||||
return _ranges
|
||||
}
|
||||
|
||||
// MARK: NSCopying
|
||||
|
||||
open override func copyWithZone(_ zone: NSZone?) -> AnyObject
|
||||
{
|
||||
let copy = super.copyWithZone(zone) as! BarChartDataEntry
|
||||
copy._yVals = _yVals
|
||||
copy.y = y
|
||||
copy._negativeSum = _negativeSum
|
||||
return copy
|
||||
}
|
||||
|
||||
/// Calculates the sum across all values of the given stack.
|
||||
///
|
||||
/// - parameter vals:
|
||||
/// - returns:
|
||||
private static func calcSum(values: [Double]?) -> Double
|
||||
{
|
||||
guard let values = values
|
||||
else { return 0.0 }
|
||||
|
||||
var sum = 0.0
|
||||
|
||||
for f in values
|
||||
{
|
||||
sum += f
|
||||
}
|
||||
|
||||
return sum
|
||||
}
|
||||
}
|
||||
165
Pods/Charts/Source/Charts/Data/Implementations/Standard/BarChartDataSet.swift
generated
Normal file
165
Pods/Charts/Source/Charts/Data/Implementations/Standard/BarChartDataSet.swift
generated
Normal file
@@ -0,0 +1,165 @@
|
||||
//
|
||||
// BarChartDataSet.swift
|
||||
// Charts
|
||||
//
|
||||
// Copyright 2015 Daniel Cohen Gindi & Philipp Jahoda
|
||||
// A port of MPAndroidChart for iOS
|
||||
// Licensed under Apache License 2.0
|
||||
//
|
||||
// https://github.com/danielgindi/Charts
|
||||
//
|
||||
|
||||
import Foundation
|
||||
import CoreGraphics
|
||||
|
||||
|
||||
open class BarChartDataSet: BarLineScatterCandleBubbleChartDataSet, IBarChartDataSet
|
||||
{
|
||||
private func initialize()
|
||||
{
|
||||
self.highlightColor = NSUIColor.black
|
||||
|
||||
self.calcStackSize(entries: values as! [BarChartDataEntry])
|
||||
self.calcEntryCountIncludingStacks(entries: values as! [BarChartDataEntry])
|
||||
}
|
||||
|
||||
public required init()
|
||||
{
|
||||
super.init()
|
||||
initialize()
|
||||
}
|
||||
|
||||
public override init(values: [ChartDataEntry]?, label: String?)
|
||||
{
|
||||
super.init(values: values, label: label)
|
||||
initialize()
|
||||
}
|
||||
|
||||
// MARK: - Data functions and accessors
|
||||
|
||||
/// the maximum number of bars that are stacked upon each other, this value
|
||||
/// is calculated from the Entries that are added to the DataSet
|
||||
private var _stackSize = 1
|
||||
|
||||
/// the overall entry count, including counting each stack-value individually
|
||||
private var _entryCountStacks = 0
|
||||
|
||||
/// Calculates the total number of entries this DataSet represents, including
|
||||
/// stacks. All values belonging to a stack are calculated separately.
|
||||
private func calcEntryCountIncludingStacks(entries: [BarChartDataEntry])
|
||||
{
|
||||
_entryCountStacks = 0
|
||||
|
||||
for i in 0 ..< entries.count
|
||||
{
|
||||
if let vals = entries[i].yValues
|
||||
{
|
||||
_entryCountStacks += vals.count
|
||||
}
|
||||
else
|
||||
{
|
||||
_entryCountStacks += 1
|
||||
}
|
||||
}
|
||||
}
|
||||
|
||||
/// calculates the maximum stacksize that occurs in the Entries array of this DataSet
|
||||
private func calcStackSize(entries: [BarChartDataEntry])
|
||||
{
|
||||
for i in 0 ..< entries.count
|
||||
{
|
||||
if let vals = entries[i].yValues
|
||||
{
|
||||
if vals.count > _stackSize
|
||||
{
|
||||
_stackSize = vals.count
|
||||
}
|
||||
}
|
||||
}
|
||||
}
|
||||
|
||||
open override func calcMinMax(entry e: ChartDataEntry)
|
||||
{
|
||||
guard let e = e as? BarChartDataEntry
|
||||
else { return }
|
||||
|
||||
if !e.y.isNaN
|
||||
{
|
||||
if e.yValues == nil
|
||||
{
|
||||
if e.y < _yMin
|
||||
{
|
||||
_yMin = e.y
|
||||
}
|
||||
|
||||
if e.y > _yMax
|
||||
{
|
||||
_yMax = e.y
|
||||
}
|
||||
}
|
||||
else
|
||||
{
|
||||
if -e.negativeSum < _yMin
|
||||
{
|
||||
_yMin = -e.negativeSum
|
||||
}
|
||||
|
||||
if e.positiveSum > _yMax
|
||||
{
|
||||
_yMax = e.positiveSum
|
||||
}
|
||||
}
|
||||
|
||||
calcMinMaxX(entry: e)
|
||||
}
|
||||
}
|
||||
|
||||
/// - returns: The maximum number of bars that can be stacked upon another in this DataSet.
|
||||
open var stackSize: Int
|
||||
{
|
||||
return _stackSize
|
||||
}
|
||||
|
||||
/// - returns: `true` if this DataSet is stacked (stacksize > 1) or not.
|
||||
open var isStacked: Bool
|
||||
{
|
||||
return _stackSize > 1 ? true : false
|
||||
}
|
||||
|
||||
/// - returns: The overall entry count, including counting each stack-value individually
|
||||
@objc open var entryCountStacks: Int
|
||||
{
|
||||
return _entryCountStacks
|
||||
}
|
||||
|
||||
/// array of labels used to describe the different values of the stacked bars
|
||||
open var stackLabels: [String] = ["Stack"]
|
||||
|
||||
// MARK: - Styling functions and accessors
|
||||
|
||||
/// the color used for drawing the bar-shadows. The bar shadows is a surface behind the bar that indicates the maximum value
|
||||
open var barShadowColor = NSUIColor(red: 215.0/255.0, green: 215.0/255.0, blue: 215.0/255.0, alpha: 1.0)
|
||||
|
||||
/// the width used for drawing borders around the bars. If borderWidth == 0, no border will be drawn.
|
||||
open var barBorderWidth : CGFloat = 0.0
|
||||
|
||||
/// the color drawing borders around the bars.
|
||||
open var barBorderColor = NSUIColor.black
|
||||
|
||||
/// the alpha value (transparency) that is used for drawing the highlight indicator bar. min = 0.0 (fully transparent), max = 1.0 (fully opaque)
|
||||
open var highlightAlpha = CGFloat(120.0 / 255.0)
|
||||
|
||||
// MARK: - NSCopying
|
||||
|
||||
open override func copyWithZone(_ zone: NSZone?) -> AnyObject
|
||||
{
|
||||
let copy = super.copyWithZone(zone) as! BarChartDataSet
|
||||
copy._stackSize = _stackSize
|
||||
copy._entryCountStacks = _entryCountStacks
|
||||
copy.stackLabels = stackLabels
|
||||
|
||||
copy.barShadowColor = barShadowColor
|
||||
copy.highlightAlpha = highlightAlpha
|
||||
return copy
|
||||
}
|
||||
}
|
||||
25
Pods/Charts/Source/Charts/Data/Implementations/Standard/BarLineScatterCandleBubbleChartData.swift
generated
Normal file
25
Pods/Charts/Source/Charts/Data/Implementations/Standard/BarLineScatterCandleBubbleChartData.swift
generated
Normal file
@@ -0,0 +1,25 @@
|
||||
//
|
||||
// BarLineScatterCandleBubbleChartData.swift
|
||||
// Charts
|
||||
//
|
||||
// Copyright 2015 Daniel Cohen Gindi & Philipp Jahoda
|
||||
// A port of MPAndroidChart for iOS
|
||||
// Licensed under Apache License 2.0
|
||||
//
|
||||
// https://github.com/danielgindi/Charts
|
||||
//
|
||||
|
||||
import Foundation
|
||||
|
||||
open class BarLineScatterCandleBubbleChartData: ChartData
|
||||
{
|
||||
public override init()
|
||||
{
|
||||
super.init()
|
||||
}
|
||||
|
||||
public override init(dataSets: [IChartDataSet]?)
|
||||
{
|
||||
super.init(dataSets: dataSets)
|
||||
}
|
||||
}
|
||||
38
Pods/Charts/Source/Charts/Data/Implementations/Standard/BarLineScatterCandleBubbleChartDataSet.swift
generated
Normal file
38
Pods/Charts/Source/Charts/Data/Implementations/Standard/BarLineScatterCandleBubbleChartDataSet.swift
generated
Normal file
@@ -0,0 +1,38 @@
|
||||
//
|
||||
// BarLineScatterCandleBubbleChartDataSet.swift
|
||||
// Charts
|
||||
//
|
||||
// Copyright 2015 Daniel Cohen Gindi & Philipp Jahoda
|
||||
// A port of MPAndroidChart for iOS
|
||||
// Licensed under Apache License 2.0
|
||||
//
|
||||
// https://github.com/danielgindi/Charts
|
||||
//
|
||||
|
||||
import Foundation
|
||||
import CoreGraphics
|
||||
|
||||
|
||||
open class BarLineScatterCandleBubbleChartDataSet: ChartDataSet, IBarLineScatterCandleBubbleChartDataSet
|
||||
{
|
||||
// MARK: - Data functions and accessors
|
||||
|
||||
// MARK: - Styling functions and accessors
|
||||
|
||||
open var highlightColor = NSUIColor(red: 255.0/255.0, green: 187.0/255.0, blue: 115.0/255.0, alpha: 1.0)
|
||||
open var highlightLineWidth = CGFloat(0.5)
|
||||
open var highlightLineDashPhase = CGFloat(0.0)
|
||||
open var highlightLineDashLengths: [CGFloat]?
|
||||
|
||||
// MARK: - NSCopying
|
||||
|
||||
open override func copyWithZone(_ zone: NSZone?) -> AnyObject
|
||||
{
|
||||
let copy = super.copyWithZone(zone) as! BarLineScatterCandleBubbleChartDataSet
|
||||
copy.highlightColor = highlightColor
|
||||
copy.highlightLineWidth = highlightLineWidth
|
||||
copy.highlightLineDashPhase = highlightLineDashPhase
|
||||
copy.highlightLineDashLengths = highlightLineDashLengths
|
||||
return copy
|
||||
}
|
||||
}
|
||||
32
Pods/Charts/Source/Charts/Data/Implementations/Standard/BubbleChartData.swift
generated
Normal file
32
Pods/Charts/Source/Charts/Data/Implementations/Standard/BubbleChartData.swift
generated
Normal file
@@ -0,0 +1,32 @@
|
||||
//
|
||||
// BubbleChartData.swift
|
||||
// Charts
|
||||
//
|
||||
// Bubble chart implementation:
|
||||
// Copyright 2015 Pierre-Marc Airoldi
|
||||
// Licensed under Apache License 2.0
|
||||
//
|
||||
// https://github.com/danielgindi/Charts
|
||||
//
|
||||
|
||||
import Foundation
|
||||
import CoreGraphics
|
||||
|
||||
open class BubbleChartData: BarLineScatterCandleBubbleChartData
|
||||
{
|
||||
public override init()
|
||||
{
|
||||
super.init()
|
||||
}
|
||||
|
||||
public override init(dataSets: [IChartDataSet]?)
|
||||
{
|
||||
super.init(dataSets: dataSets)
|
||||
}
|
||||
|
||||
/// Sets the width of the circle that surrounds the bubble when highlighted for all DataSet objects this data object contains
|
||||
@objc open func setHighlightCircleWidth(_ width: CGFloat)
|
||||
{
|
||||
(_dataSets as? [IBubbleChartDataSet])?.forEach { $0.highlightCircleWidth = width }
|
||||
}
|
||||
}
|
||||
77
Pods/Charts/Source/Charts/Data/Implementations/Standard/BubbleChartDataEntry.swift
generated
Normal file
77
Pods/Charts/Source/Charts/Data/Implementations/Standard/BubbleChartDataEntry.swift
generated
Normal file
@@ -0,0 +1,77 @@
|
||||
//
|
||||
// BubbleDataEntry.swift
|
||||
// Charts
|
||||
//
|
||||
// Bubble chart implementation:
|
||||
// Copyright 2015 Pierre-Marc Airoldi
|
||||
// Licensed under Apache License 2.0
|
||||
//
|
||||
// https://github.com/danielgindi/Charts
|
||||
//
|
||||
|
||||
import Foundation
|
||||
import CoreGraphics
|
||||
|
||||
open class BubbleChartDataEntry: ChartDataEntry
|
||||
{
|
||||
/// The size of the bubble.
|
||||
@objc open var size = CGFloat(0.0)
|
||||
|
||||
public required init()
|
||||
{
|
||||
super.init()
|
||||
}
|
||||
|
||||
/// - parameter x: The index on the x-axis.
|
||||
/// - parameter y: The value on the y-axis.
|
||||
/// - parameter size: The size of the bubble.
|
||||
@objc public init(x: Double, y: Double, size: CGFloat)
|
||||
{
|
||||
super.init(x: x, y: y)
|
||||
|
||||
self.size = size
|
||||
}
|
||||
|
||||
/// - parameter x: The index on the x-axis.
|
||||
/// - parameter y: The value on the y-axis.
|
||||
/// - parameter size: The size of the bubble.
|
||||
/// - parameter data: Spot for additional data this Entry represents.
|
||||
@objc public init(x: Double, y: Double, size: CGFloat, data: AnyObject?)
|
||||
{
|
||||
super.init(x: x, y: y, data: data)
|
||||
|
||||
self.size = size
|
||||
}
|
||||
|
||||
/// - parameter x: The index on the x-axis.
|
||||
/// - parameter y: The value on the y-axis.
|
||||
/// - parameter size: The size of the bubble.
|
||||
/// - parameter icon: icon image
|
||||
@objc public init(x: Double, y: Double, size: CGFloat, icon: NSUIImage?)
|
||||
{
|
||||
super.init(x: x, y: y, icon: icon)
|
||||
|
||||
self.size = size
|
||||
}
|
||||
|
||||
/// - parameter x: The index on the x-axis.
|
||||
/// - parameter y: The value on the y-axis.
|
||||
/// - parameter size: The size of the bubble.
|
||||
/// - parameter icon: icon image
|
||||
/// - parameter data: Spot for additional data this Entry represents.
|
||||
@objc public init(x: Double, y: Double, size: CGFloat, icon: NSUIImage?, data: AnyObject?)
|
||||
{
|
||||
super.init(x: x, y: y, icon: icon, data: data)
|
||||
|
||||
self.size = size
|
||||
}
|
||||
|
||||
// MARK: NSCopying
|
||||
|
||||
open override func copyWithZone(_ zone: NSZone?) -> AnyObject
|
||||
{
|
||||
let copy = super.copyWithZone(zone) as! BubbleChartDataEntry
|
||||
copy.size = size
|
||||
return copy
|
||||
}
|
||||
}
|
||||
57
Pods/Charts/Source/Charts/Data/Implementations/Standard/BubbleChartDataSet.swift
generated
Normal file
57
Pods/Charts/Source/Charts/Data/Implementations/Standard/BubbleChartDataSet.swift
generated
Normal file
@@ -0,0 +1,57 @@
|
||||
//
|
||||
// BubbleChartDataSet.swift
|
||||
// Charts
|
||||
//
|
||||
// Bubble chart implementation:
|
||||
// Copyright 2015 Pierre-Marc Airoldi
|
||||
// Licensed under Apache License 2.0
|
||||
//
|
||||
// https://github.com/danielgindi/Charts
|
||||
//
|
||||
|
||||
import Foundation
|
||||
import CoreGraphics
|
||||
|
||||
|
||||
open class BubbleChartDataSet: BarLineScatterCandleBubbleChartDataSet, IBubbleChartDataSet
|
||||
{
|
||||
// MARK: - Data functions and accessors
|
||||
|
||||
internal var _maxSize = CGFloat(0.0)
|
||||
|
||||
open var maxSize: CGFloat { return _maxSize }
|
||||
@objc open var normalizeSizeEnabled: Bool = true
|
||||
open var isNormalizeSizeEnabled: Bool { return normalizeSizeEnabled }
|
||||
|
||||
open override func calcMinMax(entry e: ChartDataEntry)
|
||||
{
|
||||
guard let e = e as? BubbleChartDataEntry
|
||||
else { return }
|
||||
|
||||
super.calcMinMax(entry: e)
|
||||
|
||||
let size = e.size
|
||||
|
||||
if size > _maxSize
|
||||
{
|
||||
_maxSize = size
|
||||
}
|
||||
}
|
||||
|
||||
// MARK: - Styling functions and accessors
|
||||
|
||||
/// Sets/gets the width of the circle that surrounds the bubble when highlighted
|
||||
open var highlightCircleWidth: CGFloat = 2.5
|
||||
|
||||
// MARK: - NSCopying
|
||||
|
||||
open override func copyWithZone(_ zone: NSZone?) -> AnyObject
|
||||
{
|
||||
let copy = super.copyWithZone(zone) as! BubbleChartDataSet
|
||||
copy._xMin = _xMin
|
||||
copy._xMax = _xMax
|
||||
copy._maxSize = _maxSize
|
||||
copy.highlightCircleWidth = highlightCircleWidth
|
||||
return copy
|
||||
}
|
||||
}
|
||||
25
Pods/Charts/Source/Charts/Data/Implementations/Standard/CandleChartData.swift
generated
Normal file
25
Pods/Charts/Source/Charts/Data/Implementations/Standard/CandleChartData.swift
generated
Normal file
@@ -0,0 +1,25 @@
|
||||
//
|
||||
// CandleChartData.swift
|
||||
// Charts
|
||||
//
|
||||
// Copyright 2015 Daniel Cohen Gindi & Philipp Jahoda
|
||||
// A port of MPAndroidChart for iOS
|
||||
// Licensed under Apache License 2.0
|
||||
//
|
||||
// https://github.com/danielgindi/Charts
|
||||
//
|
||||
|
||||
import Foundation
|
||||
|
||||
open class CandleChartData: BarLineScatterCandleBubbleChartData
|
||||
{
|
||||
public override init()
|
||||
{
|
||||
super.init()
|
||||
}
|
||||
|
||||
public override init(dataSets: [IChartDataSet]?)
|
||||
{
|
||||
super.init(dataSets: dataSets)
|
||||
}
|
||||
}
|
||||
109
Pods/Charts/Source/Charts/Data/Implementations/Standard/CandleChartDataEntry.swift
generated
Normal file
109
Pods/Charts/Source/Charts/Data/Implementations/Standard/CandleChartDataEntry.swift
generated
Normal file
@@ -0,0 +1,109 @@
|
||||
//
|
||||
// CandleChartDataEntry.swift
|
||||
// Charts
|
||||
//
|
||||
// Copyright 2015 Daniel Cohen Gindi & Philipp Jahoda
|
||||
// A port of MPAndroidChart for iOS
|
||||
// Licensed under Apache License 2.0
|
||||
//
|
||||
// https://github.com/danielgindi/Charts
|
||||
//
|
||||
|
||||
import Foundation
|
||||
|
||||
open class CandleChartDataEntry: ChartDataEntry
|
||||
{
|
||||
/// shadow-high value
|
||||
@objc open var high = Double(0.0)
|
||||
|
||||
/// shadow-low value
|
||||
@objc open var low = Double(0.0)
|
||||
|
||||
/// close value
|
||||
@objc open var close = Double(0.0)
|
||||
|
||||
/// open value
|
||||
@objc open var open = Double(0.0)
|
||||
|
||||
public required init()
|
||||
{
|
||||
super.init()
|
||||
}
|
||||
|
||||
@objc public init(x: Double, shadowH: Double, shadowL: Double, open: Double, close: Double)
|
||||
{
|
||||
super.init(x: x, y: (shadowH + shadowL) / 2.0)
|
||||
|
||||
self.high = shadowH
|
||||
self.low = shadowL
|
||||
self.open = open
|
||||
self.close = close
|
||||
}
|
||||
|
||||
@objc public init(x: Double, shadowH: Double, shadowL: Double, open: Double, close: Double, data: AnyObject?)
|
||||
{
|
||||
super.init(x: x, y: (shadowH + shadowL) / 2.0, data: data)
|
||||
|
||||
self.high = shadowH
|
||||
self.low = shadowL
|
||||
self.open = open
|
||||
self.close = close
|
||||
}
|
||||
|
||||
@objc public init(x: Double, shadowH: Double, shadowL: Double, open: Double, close: Double, icon: NSUIImage?)
|
||||
{
|
||||
super.init(x: x, y: (shadowH + shadowL) / 2.0, icon: icon)
|
||||
|
||||
self.high = shadowH
|
||||
self.low = shadowL
|
||||
self.open = open
|
||||
self.close = close
|
||||
}
|
||||
|
||||
@objc public init(x: Double, shadowH: Double, shadowL: Double, open: Double, close: Double, icon: NSUIImage?, data: AnyObject?)
|
||||
{
|
||||
super.init(x: x, y: (shadowH + shadowL) / 2.0, icon: icon, data: data)
|
||||
|
||||
self.high = shadowH
|
||||
self.low = shadowL
|
||||
self.open = open
|
||||
self.close = close
|
||||
}
|
||||
|
||||
/// - returns: The overall range (difference) between shadow-high and shadow-low.
|
||||
@objc open var shadowRange: Double
|
||||
{
|
||||
return abs(high - low)
|
||||
}
|
||||
|
||||
/// - returns: The body size (difference between open and close).
|
||||
@objc open var bodyRange: Double
|
||||
{
|
||||
return abs(open - close)
|
||||
}
|
||||
|
||||
/// the center value of the candle. (Middle value between high and low)
|
||||
open override var y: Double
|
||||
{
|
||||
get
|
||||
{
|
||||
return super.y
|
||||
}
|
||||
set
|
||||
{
|
||||
super.y = (high + low) / 2.0
|
||||
}
|
||||
}
|
||||
|
||||
// MARK: NSCopying
|
||||
|
||||
open override func copyWithZone(_ zone: NSZone?) -> AnyObject
|
||||
{
|
||||
let copy = super.copyWithZone(zone) as! CandleChartDataEntry
|
||||
copy.high = high
|
||||
copy.low = low
|
||||
copy.open = open
|
||||
copy.close = close
|
||||
return copy
|
||||
}
|
||||
}
|
||||
147
Pods/Charts/Source/Charts/Data/Implementations/Standard/CandleChartDataSet.swift
generated
Normal file
147
Pods/Charts/Source/Charts/Data/Implementations/Standard/CandleChartDataSet.swift
generated
Normal file
@@ -0,0 +1,147 @@
|
||||
//
|
||||
// CandleChartDataSet.swift
|
||||
// Charts
|
||||
//
|
||||
// Copyright 2015 Daniel Cohen Gindi & Philipp Jahoda
|
||||
// A port of MPAndroidChart for iOS
|
||||
// Licensed under Apache License 2.0
|
||||
//
|
||||
// https://github.com/danielgindi/Charts
|
||||
//
|
||||
|
||||
import Foundation
|
||||
import CoreGraphics
|
||||
|
||||
|
||||
open class CandleChartDataSet: LineScatterCandleRadarChartDataSet, ICandleChartDataSet
|
||||
{
|
||||
|
||||
public required init()
|
||||
{
|
||||
super.init()
|
||||
}
|
||||
|
||||
public override init(values: [ChartDataEntry]?, label: String?)
|
||||
{
|
||||
super.init(values: values, label: label)
|
||||
}
|
||||
|
||||
// MARK: - Data functions and accessors
|
||||
|
||||
open override func calcMinMax(entry e: ChartDataEntry)
|
||||
{
|
||||
guard let e = e as? CandleChartDataEntry
|
||||
else { return }
|
||||
|
||||
if e.low < _yMin
|
||||
{
|
||||
_yMin = e.low
|
||||
}
|
||||
|
||||
if e.high > _yMax
|
||||
{
|
||||
_yMax = e.high
|
||||
}
|
||||
|
||||
calcMinMaxX(entry: e)
|
||||
}
|
||||
|
||||
open override func calcMinMaxY(entry e: ChartDataEntry)
|
||||
{
|
||||
guard let e = e as? CandleChartDataEntry
|
||||
else { return }
|
||||
|
||||
if e.high < _yMin
|
||||
{
|
||||
_yMin = e.high
|
||||
}
|
||||
if e.high > _yMax
|
||||
{
|
||||
_yMax = e.high
|
||||
}
|
||||
|
||||
if e.low < _yMin
|
||||
{
|
||||
_yMin = e.low
|
||||
}
|
||||
if e.low > _yMax
|
||||
{
|
||||
_yMax = e.low
|
||||
}
|
||||
}
|
||||
|
||||
// MARK: - Styling functions and accessors
|
||||
|
||||
/// the space between the candle entries
|
||||
///
|
||||
/// **default**: 0.1 (10%)
|
||||
private var _barSpace = CGFloat(0.1)
|
||||
|
||||
/// the space that is left out on the left and right side of each candle,
|
||||
/// **default**: 0.1 (10%), max 0.45, min 0.0
|
||||
open var barSpace: CGFloat
|
||||
{
|
||||
set
|
||||
{
|
||||
if newValue < 0.0
|
||||
{
|
||||
_barSpace = 0.0
|
||||
}
|
||||
else if newValue > 0.45
|
||||
{
|
||||
_barSpace = 0.45
|
||||
}
|
||||
else
|
||||
{
|
||||
_barSpace = newValue
|
||||
}
|
||||
}
|
||||
get
|
||||
{
|
||||
return _barSpace
|
||||
}
|
||||
}
|
||||
|
||||
/// should the candle bars show?
|
||||
/// when false, only "ticks" will show
|
||||
///
|
||||
/// **default**: true
|
||||
open var showCandleBar: Bool = true
|
||||
|
||||
/// the width of the candle-shadow-line in pixels.
|
||||
///
|
||||
/// **default**: 1.5
|
||||
open var shadowWidth = CGFloat(1.5)
|
||||
|
||||
/// the color of the shadow line
|
||||
open var shadowColor: NSUIColor?
|
||||
|
||||
/// use candle color for the shadow
|
||||
open var shadowColorSameAsCandle = false
|
||||
|
||||
/// Is the shadow color same as the candle color?
|
||||
open var isShadowColorSameAsCandle: Bool { return shadowColorSameAsCandle }
|
||||
|
||||
/// color for open == close
|
||||
open var neutralColor: NSUIColor?
|
||||
|
||||
/// color for open > close
|
||||
open var increasingColor: NSUIColor?
|
||||
|
||||
/// color for open < close
|
||||
open var decreasingColor: NSUIColor?
|
||||
|
||||
/// Are increasing values drawn as filled?
|
||||
/// increasing candlesticks are traditionally hollow
|
||||
open var increasingFilled = false
|
||||
|
||||
/// Are increasing values drawn as filled?
|
||||
open var isIncreasingFilled: Bool { return increasingFilled }
|
||||
|
||||
/// Are decreasing values drawn as filled?
|
||||
/// descreasing candlesticks are traditionally filled
|
||||
open var decreasingFilled = true
|
||||
|
||||
/// Are decreasing values drawn as filled?
|
||||
open var isDecreasingFilled: Bool { return decreasingFilled }
|
||||
}
|
||||
759
Pods/Charts/Source/Charts/Data/Implementations/Standard/ChartData.swift
generated
Normal file
759
Pods/Charts/Source/Charts/Data/Implementations/Standard/ChartData.swift
generated
Normal file
@@ -0,0 +1,759 @@
|
||||
//
|
||||
// ChartData.swift
|
||||
// Charts
|
||||
//
|
||||
// Copyright 2015 Daniel Cohen Gindi & Philipp Jahoda
|
||||
// A port of MPAndroidChart for iOS
|
||||
// Licensed under Apache License 2.0
|
||||
//
|
||||
// https://github.com/danielgindi/Charts
|
||||
//
|
||||
|
||||
import Foundation
|
||||
|
||||
open class ChartData: NSObject
|
||||
{
|
||||
internal var _yMax: Double = -Double.greatestFiniteMagnitude
|
||||
internal var _yMin: Double = Double.greatestFiniteMagnitude
|
||||
internal var _xMax: Double = -Double.greatestFiniteMagnitude
|
||||
internal var _xMin: Double = Double.greatestFiniteMagnitude
|
||||
internal var _leftAxisMax: Double = -Double.greatestFiniteMagnitude
|
||||
internal var _leftAxisMin: Double = Double.greatestFiniteMagnitude
|
||||
internal var _rightAxisMax: Double = -Double.greatestFiniteMagnitude
|
||||
internal var _rightAxisMin: Double = Double.greatestFiniteMagnitude
|
||||
|
||||
internal var _dataSets = [IChartDataSet]()
|
||||
|
||||
public override init()
|
||||
{
|
||||
super.init()
|
||||
|
||||
_dataSets = [IChartDataSet]()
|
||||
}
|
||||
|
||||
@objc public init(dataSets: [IChartDataSet]?)
|
||||
{
|
||||
super.init()
|
||||
|
||||
_dataSets = dataSets ?? [IChartDataSet]()
|
||||
|
||||
self.initialize(dataSets: _dataSets)
|
||||
}
|
||||
|
||||
@objc public convenience init(dataSet: IChartDataSet?)
|
||||
{
|
||||
self.init(dataSets: dataSet === nil ? nil : [dataSet!])
|
||||
}
|
||||
|
||||
internal func initialize(dataSets: [IChartDataSet])
|
||||
{
|
||||
notifyDataChanged()
|
||||
}
|
||||
|
||||
/// Call this method to let the ChartData know that the underlying data has changed.
|
||||
/// Calling this performs all necessary recalculations needed when the contained data has changed.
|
||||
@objc open func notifyDataChanged()
|
||||
{
|
||||
calcMinMax()
|
||||
}
|
||||
|
||||
@objc open func calcMinMaxY(fromX: Double, toX: Double)
|
||||
{
|
||||
for set in _dataSets
|
||||
{
|
||||
set.calcMinMaxY(fromX: fromX, toX: toX)
|
||||
}
|
||||
|
||||
// apply the new data
|
||||
calcMinMax()
|
||||
}
|
||||
|
||||
/// calc minimum and maximum y value over all datasets
|
||||
@objc open func calcMinMax()
|
||||
{
|
||||
_yMax = -Double.greatestFiniteMagnitude
|
||||
_yMin = Double.greatestFiniteMagnitude
|
||||
_xMax = -Double.greatestFiniteMagnitude
|
||||
_xMin = Double.greatestFiniteMagnitude
|
||||
|
||||
for set in _dataSets
|
||||
{
|
||||
calcMinMax(dataSet: set)
|
||||
}
|
||||
|
||||
_leftAxisMax = -Double.greatestFiniteMagnitude
|
||||
_leftAxisMin = Double.greatestFiniteMagnitude
|
||||
_rightAxisMax = -Double.greatestFiniteMagnitude
|
||||
_rightAxisMin = Double.greatestFiniteMagnitude
|
||||
|
||||
// left axis
|
||||
let firstLeft = getFirstLeft(dataSets: dataSets)
|
||||
|
||||
if firstLeft !== nil
|
||||
{
|
||||
_leftAxisMax = firstLeft!.yMax
|
||||
_leftAxisMin = firstLeft!.yMin
|
||||
|
||||
for dataSet in _dataSets
|
||||
{
|
||||
if dataSet.axisDependency == .left
|
||||
{
|
||||
if dataSet.yMin < _leftAxisMin
|
||||
{
|
||||
_leftAxisMin = dataSet.yMin
|
||||
}
|
||||
|
||||
if dataSet.yMax > _leftAxisMax
|
||||
{
|
||||
_leftAxisMax = dataSet.yMax
|
||||
}
|
||||
}
|
||||
}
|
||||
}
|
||||
|
||||
// right axis
|
||||
let firstRight = getFirstRight(dataSets: dataSets)
|
||||
|
||||
if firstRight !== nil
|
||||
{
|
||||
_rightAxisMax = firstRight!.yMax
|
||||
_rightAxisMin = firstRight!.yMin
|
||||
|
||||
for dataSet in _dataSets
|
||||
{
|
||||
if dataSet.axisDependency == .right
|
||||
{
|
||||
if dataSet.yMin < _rightAxisMin
|
||||
{
|
||||
_rightAxisMin = dataSet.yMin
|
||||
}
|
||||
|
||||
if dataSet.yMax > _rightAxisMax
|
||||
{
|
||||
_rightAxisMax = dataSet.yMax
|
||||
}
|
||||
}
|
||||
}
|
||||
}
|
||||
}
|
||||
|
||||
/// Adjusts the current minimum and maximum values based on the provided Entry object.
|
||||
@objc open func calcMinMax(entry e: ChartDataEntry, axis: YAxis.AxisDependency)
|
||||
{
|
||||
if _yMax < e.y
|
||||
{
|
||||
_yMax = e.y
|
||||
}
|
||||
|
||||
if _yMin > e.y
|
||||
{
|
||||
_yMin = e.y
|
||||
}
|
||||
|
||||
if _xMax < e.x
|
||||
{
|
||||
_xMax = e.x
|
||||
}
|
||||
|
||||
if _xMin > e.x
|
||||
{
|
||||
_xMin = e.x
|
||||
}
|
||||
|
||||
if axis == .left
|
||||
{
|
||||
if _leftAxisMax < e.y
|
||||
{
|
||||
_leftAxisMax = e.y
|
||||
}
|
||||
|
||||
if _leftAxisMin > e.y
|
||||
{
|
||||
_leftAxisMin = e.y
|
||||
}
|
||||
}
|
||||
else
|
||||
{
|
||||
if _rightAxisMax < e.y
|
||||
{
|
||||
_rightAxisMax = e.y
|
||||
}
|
||||
|
||||
if _rightAxisMin > e.y
|
||||
{
|
||||
_rightAxisMin = e.y
|
||||
}
|
||||
}
|
||||
}
|
||||
|
||||
/// Adjusts the minimum and maximum values based on the given DataSet.
|
||||
@objc open func calcMinMax(dataSet d: IChartDataSet)
|
||||
{
|
||||
if _yMax < d.yMax
|
||||
{
|
||||
_yMax = d.yMax
|
||||
}
|
||||
|
||||
if _yMin > d.yMin
|
||||
{
|
||||
_yMin = d.yMin
|
||||
}
|
||||
|
||||
if _xMax < d.xMax
|
||||
{
|
||||
_xMax = d.xMax
|
||||
}
|
||||
|
||||
if _xMin > d.xMin
|
||||
{
|
||||
_xMin = d.xMin
|
||||
}
|
||||
|
||||
if d.axisDependency == .left
|
||||
{
|
||||
if _leftAxisMax < d.yMax
|
||||
{
|
||||
_leftAxisMax = d.yMax
|
||||
}
|
||||
|
||||
if _leftAxisMin > d.yMin
|
||||
{
|
||||
_leftAxisMin = d.yMin
|
||||
}
|
||||
}
|
||||
else
|
||||
{
|
||||
if _rightAxisMax < d.yMax
|
||||
{
|
||||
_rightAxisMax = d.yMax
|
||||
}
|
||||
|
||||
if _rightAxisMin > d.yMin
|
||||
{
|
||||
_rightAxisMin = d.yMin
|
||||
}
|
||||
}
|
||||
}
|
||||
|
||||
/// - returns: The number of LineDataSets this object contains
|
||||
@objc open var dataSetCount: Int
|
||||
{
|
||||
return _dataSets.count
|
||||
}
|
||||
|
||||
/// - returns: The smallest y-value the data object contains.
|
||||
@objc open var yMin: Double
|
||||
{
|
||||
return _yMin
|
||||
}
|
||||
|
||||
@nonobjc
|
||||
open func getYMin() -> Double
|
||||
{
|
||||
return _yMin
|
||||
}
|
||||
|
||||
@objc open func getYMin(axis: YAxis.AxisDependency) -> Double
|
||||
{
|
||||
if axis == .left
|
||||
{
|
||||
if _leftAxisMin == Double.greatestFiniteMagnitude
|
||||
{
|
||||
return _rightAxisMin
|
||||
}
|
||||
else
|
||||
{
|
||||
return _leftAxisMin
|
||||
}
|
||||
}
|
||||
else
|
||||
{
|
||||
if _rightAxisMin == Double.greatestFiniteMagnitude
|
||||
{
|
||||
return _leftAxisMin
|
||||
}
|
||||
else
|
||||
{
|
||||
return _rightAxisMin
|
||||
}
|
||||
}
|
||||
}
|
||||
|
||||
/// - returns: The greatest y-value the data object contains.
|
||||
@objc open var yMax: Double
|
||||
{
|
||||
return _yMax
|
||||
}
|
||||
|
||||
@nonobjc
|
||||
open func getYMax() -> Double
|
||||
{
|
||||
return _yMax
|
||||
}
|
||||
|
||||
@objc open func getYMax(axis: YAxis.AxisDependency) -> Double
|
||||
{
|
||||
if axis == .left
|
||||
{
|
||||
if _leftAxisMax == -Double.greatestFiniteMagnitude
|
||||
{
|
||||
return _rightAxisMax
|
||||
}
|
||||
else
|
||||
{
|
||||
return _leftAxisMax
|
||||
}
|
||||
}
|
||||
else
|
||||
{
|
||||
if _rightAxisMax == -Double.greatestFiniteMagnitude
|
||||
{
|
||||
return _leftAxisMax
|
||||
}
|
||||
else
|
||||
{
|
||||
return _rightAxisMax
|
||||
}
|
||||
}
|
||||
}
|
||||
|
||||
/// - returns: The minimum x-value the data object contains.
|
||||
@objc open var xMin: Double
|
||||
{
|
||||
return _xMin
|
||||
}
|
||||
/// - returns: The maximum x-value the data object contains.
|
||||
@objc open var xMax: Double
|
||||
{
|
||||
return _xMax
|
||||
}
|
||||
|
||||
/// - returns: All DataSet objects this ChartData object holds.
|
||||
@objc open var dataSets: [IChartDataSet]
|
||||
{
|
||||
get
|
||||
{
|
||||
return _dataSets
|
||||
}
|
||||
set
|
||||
{
|
||||
_dataSets = newValue
|
||||
notifyDataChanged()
|
||||
}
|
||||
}
|
||||
|
||||
/// Retrieve the index of a ChartDataSet with a specific label from the ChartData. Search can be case sensitive or not.
|
||||
///
|
||||
/// **IMPORTANT: This method does calculations at runtime, do not over-use in performance critical situations.**
|
||||
///
|
||||
/// - parameter dataSets: the DataSet array to search
|
||||
/// - parameter type:
|
||||
/// - parameter ignorecase: if true, the search is not case-sensitive
|
||||
/// - returns: The index of the DataSet Object with the given label. Sensitive or not.
|
||||
internal func getDataSetIndexByLabel(_ label: String, ignorecase: Bool) -> Int
|
||||
{
|
||||
if ignorecase
|
||||
{
|
||||
for i in 0 ..< dataSets.count
|
||||
{
|
||||
if dataSets[i].label == nil
|
||||
{
|
||||
continue
|
||||
}
|
||||
if (label.caseInsensitiveCompare(dataSets[i].label!) == ComparisonResult.orderedSame)
|
||||
{
|
||||
return i
|
||||
}
|
||||
}
|
||||
}
|
||||
else
|
||||
{
|
||||
for i in 0 ..< dataSets.count
|
||||
{
|
||||
if label == dataSets[i].label
|
||||
{
|
||||
return i
|
||||
}
|
||||
}
|
||||
}
|
||||
|
||||
return -1
|
||||
}
|
||||
|
||||
/// - returns: The labels of all DataSets as a string array.
|
||||
internal func dataSetLabels() -> [String]
|
||||
{
|
||||
var types = [String]()
|
||||
|
||||
for i in 0 ..< _dataSets.count
|
||||
{
|
||||
if dataSets[i].label == nil
|
||||
{
|
||||
continue
|
||||
}
|
||||
|
||||
types[i] = _dataSets[i].label!
|
||||
}
|
||||
|
||||
return types
|
||||
}
|
||||
|
||||
/// Get the Entry for a corresponding highlight object
|
||||
///
|
||||
/// - parameter highlight:
|
||||
/// - returns: The entry that is highlighted
|
||||
@objc open func entryForHighlight(_ highlight: Highlight) -> ChartDataEntry?
|
||||
{
|
||||
if highlight.dataSetIndex >= dataSets.count
|
||||
{
|
||||
return nil
|
||||
}
|
||||
else
|
||||
{
|
||||
return dataSets[highlight.dataSetIndex].entryForXValue(highlight.x, closestToY: highlight.y)
|
||||
}
|
||||
}
|
||||
|
||||
/// **IMPORTANT: This method does calculations at runtime. Use with care in performance critical situations.**
|
||||
///
|
||||
/// - parameter label:
|
||||
/// - parameter ignorecase:
|
||||
/// - returns: The DataSet Object with the given label. Sensitive or not.
|
||||
@objc open func getDataSetByLabel(_ label: String, ignorecase: Bool) -> IChartDataSet?
|
||||
{
|
||||
let index = getDataSetIndexByLabel(label, ignorecase: ignorecase)
|
||||
|
||||
if index < 0 || index >= _dataSets.count
|
||||
{
|
||||
return nil
|
||||
}
|
||||
else
|
||||
{
|
||||
return _dataSets[index]
|
||||
}
|
||||
}
|
||||
|
||||
@objc open func getDataSetByIndex(_ index: Int) -> IChartDataSet!
|
||||
{
|
||||
if index < 0 || index >= _dataSets.count
|
||||
{
|
||||
return nil
|
||||
}
|
||||
|
||||
return _dataSets[index]
|
||||
}
|
||||
|
||||
@objc open func addDataSet(_ dataSet: IChartDataSet!)
|
||||
{
|
||||
calcMinMax(dataSet: dataSet)
|
||||
|
||||
_dataSets.append(dataSet)
|
||||
}
|
||||
|
||||
/// Removes the given DataSet from this data object.
|
||||
/// Also recalculates all minimum and maximum values.
|
||||
///
|
||||
/// - returns: `true` if a DataSet was removed, `false` ifno DataSet could be removed.
|
||||
@objc @discardableResult open func removeDataSet(_ dataSet: IChartDataSet!) -> Bool
|
||||
{
|
||||
if dataSet === nil
|
||||
{
|
||||
return false
|
||||
}
|
||||
|
||||
for i in 0 ..< _dataSets.count
|
||||
{
|
||||
if _dataSets[i] === dataSet
|
||||
{
|
||||
return removeDataSetByIndex(i)
|
||||
}
|
||||
}
|
||||
|
||||
return false
|
||||
}
|
||||
|
||||
/// Removes the DataSet at the given index in the DataSet array from the data object.
|
||||
/// Also recalculates all minimum and maximum values.
|
||||
///
|
||||
/// - returns: `true` if a DataSet was removed, `false` ifno DataSet could be removed.
|
||||
@objc @discardableResult open func removeDataSetByIndex(_ index: Int) -> Bool
|
||||
{
|
||||
if index >= _dataSets.count || index < 0
|
||||
{
|
||||
return false
|
||||
}
|
||||
|
||||
_dataSets.remove(at: index)
|
||||
|
||||
calcMinMax()
|
||||
|
||||
return true
|
||||
}
|
||||
|
||||
/// Adds an Entry to the DataSet at the specified index. Entries are added to the end of the list.
|
||||
@objc open func addEntry(_ e: ChartDataEntry, dataSetIndex: Int)
|
||||
{
|
||||
if _dataSets.count > dataSetIndex && dataSetIndex >= 0
|
||||
{
|
||||
let set = _dataSets[dataSetIndex]
|
||||
|
||||
if !set.addEntry(e) { return }
|
||||
|
||||
calcMinMax(entry: e, axis: set.axisDependency)
|
||||
}
|
||||
else
|
||||
{
|
||||
print("ChartData.addEntry() - Cannot add Entry because dataSetIndex too high or too low.", terminator: "\n")
|
||||
}
|
||||
}
|
||||
|
||||
/// Removes the given Entry object from the DataSet at the specified index.
|
||||
@objc @discardableResult open func removeEntry(_ entry: ChartDataEntry, dataSetIndex: Int) -> Bool
|
||||
{
|
||||
// entry outofbounds
|
||||
if dataSetIndex >= _dataSets.count
|
||||
{
|
||||
return false
|
||||
}
|
||||
|
||||
// remove the entry from the dataset
|
||||
let removed = _dataSets[dataSetIndex].removeEntry(entry)
|
||||
|
||||
if removed
|
||||
{
|
||||
calcMinMax()
|
||||
}
|
||||
|
||||
return removed
|
||||
}
|
||||
|
||||
/// Removes the Entry object closest to the given xIndex from the ChartDataSet at the
|
||||
/// specified index.
|
||||
/// - returns: `true` if an entry was removed, `false` ifno Entry was found that meets the specified requirements.
|
||||
@objc @discardableResult open func removeEntry(xValue: Double, dataSetIndex: Int) -> Bool
|
||||
{
|
||||
if dataSetIndex >= _dataSets.count
|
||||
{
|
||||
return false
|
||||
}
|
||||
|
||||
if let entry = _dataSets[dataSetIndex].entryForXValue(xValue, closestToY: Double.nan)
|
||||
{
|
||||
return removeEntry(entry, dataSetIndex: dataSetIndex)
|
||||
}
|
||||
|
||||
return false
|
||||
}
|
||||
|
||||
/// - returns: The DataSet that contains the provided Entry, or null, if no DataSet contains this entry.
|
||||
@objc open func getDataSetForEntry(_ e: ChartDataEntry!) -> IChartDataSet?
|
||||
{
|
||||
if e == nil
|
||||
{
|
||||
return nil
|
||||
}
|
||||
|
||||
for i in 0 ..< _dataSets.count
|
||||
{
|
||||
let set = _dataSets[i]
|
||||
|
||||
if e === set.entryForXValue(e.x, closestToY: e.y)
|
||||
{
|
||||
return set
|
||||
}
|
||||
}
|
||||
|
||||
return nil
|
||||
}
|
||||
|
||||
/// - returns: The index of the provided DataSet in the DataSet array of this data object, or -1 if it does not exist.
|
||||
@objc open func indexOfDataSet(_ dataSet: IChartDataSet) -> Int
|
||||
{
|
||||
for i in 0 ..< _dataSets.count
|
||||
{
|
||||
if _dataSets[i] === dataSet
|
||||
{
|
||||
return i
|
||||
}
|
||||
}
|
||||
|
||||
return -1
|
||||
}
|
||||
|
||||
/// - returns: The first DataSet from the datasets-array that has it's dependency on the left axis. Returns null if no DataSet with left dependency could be found.
|
||||
@objc open func getFirstLeft(dataSets: [IChartDataSet]) -> IChartDataSet?
|
||||
{
|
||||
for dataSet in dataSets
|
||||
{
|
||||
if dataSet.axisDependency == .left
|
||||
{
|
||||
return dataSet
|
||||
}
|
||||
}
|
||||
|
||||
return nil
|
||||
}
|
||||
|
||||
/// - returns: The first DataSet from the datasets-array that has it's dependency on the right axis. Returns null if no DataSet with right dependency could be found.
|
||||
@objc open func getFirstRight(dataSets: [IChartDataSet]) -> IChartDataSet?
|
||||
{
|
||||
for dataSet in _dataSets
|
||||
{
|
||||
if dataSet.axisDependency == .right
|
||||
{
|
||||
return dataSet
|
||||
}
|
||||
}
|
||||
|
||||
return nil
|
||||
}
|
||||
|
||||
/// - returns: All colors used across all DataSet objects this object represents.
|
||||
@objc open func getColors() -> [NSUIColor]?
|
||||
{
|
||||
var clrcnt = 0
|
||||
|
||||
for i in 0 ..< _dataSets.count
|
||||
{
|
||||
clrcnt += _dataSets[i].colors.count
|
||||
}
|
||||
|
||||
var colors = [NSUIColor]()
|
||||
|
||||
for i in 0 ..< _dataSets.count
|
||||
{
|
||||
let clrs = _dataSets[i].colors
|
||||
|
||||
for clr in clrs
|
||||
{
|
||||
colors.append(clr)
|
||||
}
|
||||
}
|
||||
|
||||
return colors
|
||||
}
|
||||
|
||||
/// Sets a custom IValueFormatter for all DataSets this data object contains.
|
||||
@objc open func setValueFormatter(_ formatter: IValueFormatter?)
|
||||
{
|
||||
guard let formatter = formatter
|
||||
else { return }
|
||||
|
||||
for set in dataSets
|
||||
{
|
||||
set.valueFormatter = formatter
|
||||
}
|
||||
}
|
||||
|
||||
/// Sets the color of the value-text (color in which the value-labels are drawn) for all DataSets this data object contains.
|
||||
@objc open func setValueTextColor(_ color: NSUIColor!)
|
||||
{
|
||||
for set in dataSets
|
||||
{
|
||||
set.valueTextColor = color ?? set.valueTextColor
|
||||
}
|
||||
}
|
||||
|
||||
/// Sets the font for all value-labels for all DataSets this data object contains.
|
||||
@objc open func setValueFont(_ font: NSUIFont!)
|
||||
{
|
||||
for set in dataSets
|
||||
{
|
||||
set.valueFont = font ?? set.valueFont
|
||||
}
|
||||
}
|
||||
|
||||
/// Enables / disables drawing values (value-text) for all DataSets this data object contains.
|
||||
@objc open func setDrawValues(_ enabled: Bool)
|
||||
{
|
||||
for set in dataSets
|
||||
{
|
||||
set.drawValuesEnabled = enabled
|
||||
}
|
||||
}
|
||||
|
||||
/// Enables / disables highlighting values for all DataSets this data object contains.
|
||||
/// If set to true, this means that values can be highlighted programmatically or by touch gesture.
|
||||
@objc open var highlightEnabled: Bool
|
||||
{
|
||||
get
|
||||
{
|
||||
for set in dataSets
|
||||
{
|
||||
if !set.highlightEnabled
|
||||
{
|
||||
return false
|
||||
}
|
||||
}
|
||||
|
||||
return true
|
||||
}
|
||||
set
|
||||
{
|
||||
for set in dataSets
|
||||
{
|
||||
set.highlightEnabled = newValue
|
||||
}
|
||||
}
|
||||
}
|
||||
|
||||
/// if true, value highlightning is enabled
|
||||
@objc open var isHighlightEnabled: Bool { return highlightEnabled }
|
||||
|
||||
/// Clears this data object from all DataSets and removes all Entries.
|
||||
/// Don't forget to invalidate the chart after this.
|
||||
@objc open func clearValues()
|
||||
{
|
||||
dataSets.removeAll(keepingCapacity: false)
|
||||
notifyDataChanged()
|
||||
}
|
||||
|
||||
/// Checks if this data object contains the specified DataSet.
|
||||
/// - returns: `true` if so, `false` ifnot.
|
||||
@objc open func contains(dataSet: IChartDataSet) -> Bool
|
||||
{
|
||||
for set in dataSets
|
||||
{
|
||||
if set === dataSet
|
||||
{
|
||||
return true
|
||||
}
|
||||
}
|
||||
|
||||
return false
|
||||
}
|
||||
|
||||
/// - returns: The total entry count across all DataSet objects this data object contains.
|
||||
@objc open var entryCount: Int
|
||||
{
|
||||
var count = 0
|
||||
|
||||
for set in _dataSets
|
||||
{
|
||||
count += set.entryCount
|
||||
}
|
||||
|
||||
return count
|
||||
}
|
||||
|
||||
/// - returns: The DataSet object with the maximum number of entries or null if there are no DataSets.
|
||||
@objc open var maxEntryCountSet: IChartDataSet?
|
||||
{
|
||||
if _dataSets.count == 0
|
||||
{
|
||||
return nil
|
||||
}
|
||||
|
||||
var max = _dataSets[0]
|
||||
|
||||
for set in _dataSets
|
||||
{
|
||||
if set.entryCount > max.entryCount
|
||||
{
|
||||
max = set
|
||||
}
|
||||
}
|
||||
|
||||
return max
|
||||
}
|
||||
}
|
||||
108
Pods/Charts/Source/Charts/Data/Implementations/Standard/ChartDataEntry.swift
generated
Normal file
108
Pods/Charts/Source/Charts/Data/Implementations/Standard/ChartDataEntry.swift
generated
Normal file
@@ -0,0 +1,108 @@
|
||||
//
|
||||
// ChartDataEntry.swift
|
||||
// Charts
|
||||
//
|
||||
// Copyright 2015 Daniel Cohen Gindi & Philipp Jahoda
|
||||
// A port of MPAndroidChart for iOS
|
||||
// Licensed under Apache License 2.0
|
||||
//
|
||||
// https://github.com/danielgindi/Charts
|
||||
//
|
||||
|
||||
import Foundation
|
||||
|
||||
open class ChartDataEntry: ChartDataEntryBase
|
||||
{
|
||||
/// the x value
|
||||
@objc open var x = Double(0.0)
|
||||
|
||||
public required init()
|
||||
{
|
||||
super.init()
|
||||
}
|
||||
|
||||
/// An Entry represents one single entry in the chart.
|
||||
/// - parameter x: the x value
|
||||
/// - parameter y: the y value (the actual value of the entry)
|
||||
@objc public init(x: Double, y: Double)
|
||||
{
|
||||
super.init(y: y)
|
||||
|
||||
self.x = x
|
||||
}
|
||||
|
||||
/// An Entry represents one single entry in the chart.
|
||||
/// - parameter x: the x value
|
||||
/// - parameter y: the y value (the actual value of the entry)
|
||||
/// - parameter data: Space for additional data this Entry represents.
|
||||
|
||||
@objc public init(x: Double, y: Double, data: AnyObject?)
|
||||
{
|
||||
super.init(y: y)
|
||||
|
||||
self.x = x
|
||||
|
||||
self.data = data
|
||||
}
|
||||
|
||||
/// An Entry represents one single entry in the chart.
|
||||
/// - parameter x: the x value
|
||||
/// - parameter y: the y value (the actual value of the entry)
|
||||
/// - parameter icon: icon image
|
||||
|
||||
@objc public init(x: Double, y: Double, icon: NSUIImage?)
|
||||
{
|
||||
super.init(y: y, icon: icon)
|
||||
|
||||
self.x = x
|
||||
}
|
||||
|
||||
/// An Entry represents one single entry in the chart.
|
||||
/// - parameter x: the x value
|
||||
/// - parameter y: the y value (the actual value of the entry)
|
||||
/// - parameter icon: icon image
|
||||
/// - parameter data: Space for additional data this Entry represents.
|
||||
|
||||
@objc public init(x: Double, y: Double, icon: NSUIImage?, data: AnyObject?)
|
||||
{
|
||||
super.init(y: y, icon: icon, data: data)
|
||||
|
||||
self.x = x
|
||||
}
|
||||
|
||||
// MARK: NSObject
|
||||
|
||||
open override var description: String
|
||||
{
|
||||
return "ChartDataEntry, x: \(x), y \(y)"
|
||||
}
|
||||
|
||||
// MARK: NSCopying
|
||||
|
||||
@objc open func copyWithZone(_ zone: NSZone?) -> AnyObject
|
||||
{
|
||||
let copy = type(of: self).init()
|
||||
|
||||
copy.x = x
|
||||
copy.y = y
|
||||
copy.data = data
|
||||
|
||||
return copy
|
||||
}
|
||||
}
|
||||
|
||||
// MARK: Equatable
|
||||
extension ChartDataEntry/*: Equatable*/ {
|
||||
open override func isEqual(_ object: Any?) -> Bool {
|
||||
guard let object = object as? ChartDataEntry else { return false }
|
||||
|
||||
if self === object
|
||||
{
|
||||
return true
|
||||
}
|
||||
|
||||
return ((data == nil && object.data == nil) || (data?.isEqual(object.data) ?? false))
|
||||
&& y == object.y
|
||||
&& x == object.x
|
||||
}
|
||||
}
|
||||
95
Pods/Charts/Source/Charts/Data/Implementations/Standard/ChartDataEntryBase.swift
generated
Normal file
95
Pods/Charts/Source/Charts/Data/Implementations/Standard/ChartDataEntryBase.swift
generated
Normal file
@@ -0,0 +1,95 @@
|
||||
//
|
||||
// ChartDataEntryBase.swift
|
||||
// Charts
|
||||
//
|
||||
// Copyright 2015 Daniel Cohen Gindi & Philipp Jahoda
|
||||
// A port of MPAndroidChart for iOS
|
||||
// Licensed under Apache License 2.0
|
||||
//
|
||||
// https://github.com/danielgindi/Charts
|
||||
//
|
||||
|
||||
import Foundation
|
||||
|
||||
open class ChartDataEntryBase: NSObject
|
||||
{
|
||||
/// the y value
|
||||
@objc open var y = Double(0.0)
|
||||
|
||||
/// optional spot for additional data this Entry represents
|
||||
@objc open var data: AnyObject?
|
||||
|
||||
/// optional icon image
|
||||
@objc open var icon: NSUIImage?
|
||||
|
||||
public override required init()
|
||||
{
|
||||
super.init()
|
||||
}
|
||||
|
||||
/// An Entry represents one single entry in the chart.
|
||||
/// - parameter y: the y value (the actual value of the entry)
|
||||
@objc public init(y: Double)
|
||||
{
|
||||
super.init()
|
||||
|
||||
self.y = y
|
||||
}
|
||||
|
||||
/// - parameter y: the y value (the actual value of the entry)
|
||||
/// - parameter data: Space for additional data this Entry represents.
|
||||
|
||||
@objc public init(y: Double, data: AnyObject?)
|
||||
{
|
||||
super.init()
|
||||
|
||||
self.y = y
|
||||
self.data = data
|
||||
}
|
||||
|
||||
/// - parameter y: the y value (the actual value of the entry)
|
||||
/// - parameter icon: icon image
|
||||
|
||||
@objc public init(y: Double, icon: NSUIImage?)
|
||||
{
|
||||
super.init()
|
||||
|
||||
self.y = y
|
||||
self.icon = icon
|
||||
}
|
||||
|
||||
/// - parameter y: the y value (the actual value of the entry)
|
||||
/// - parameter icon: icon image
|
||||
/// - parameter data: Space for additional data this Entry represents.
|
||||
|
||||
@objc public init(y: Double, icon: NSUIImage?, data: AnyObject?)
|
||||
{
|
||||
super.init()
|
||||
|
||||
self.y = y
|
||||
self.icon = icon
|
||||
self.data = data
|
||||
}
|
||||
|
||||
// MARK: NSObject
|
||||
|
||||
open override var description: String
|
||||
{
|
||||
return "ChartDataEntryBase, y \(y)"
|
||||
}
|
||||
}
|
||||
|
||||
// MARK: Equatable
|
||||
extension ChartDataEntryBase/*: Equatable*/ {
|
||||
open override func isEqual(_ object: Any?) -> Bool {
|
||||
guard let object = object as? ChartDataEntryBase else { return false }
|
||||
|
||||
if self === object
|
||||
{
|
||||
return true
|
||||
}
|
||||
|
||||
return ((data == nil && object.data == nil) || (data?.isEqual(object.data) ?? false))
|
||||
&& y == object.y
|
||||
}
|
||||
}
|
||||
508
Pods/Charts/Source/Charts/Data/Implementations/Standard/ChartDataSet.swift
generated
Normal file
508
Pods/Charts/Source/Charts/Data/Implementations/Standard/ChartDataSet.swift
generated
Normal file
@@ -0,0 +1,508 @@
|
||||
//
|
||||
// ChartDataSet.swift
|
||||
// Charts
|
||||
//
|
||||
// Copyright 2015 Daniel Cohen Gindi & Philipp Jahoda
|
||||
// A port of MPAndroidChart for iOS
|
||||
// Licensed under Apache License 2.0
|
||||
//
|
||||
// https://github.com/danielgindi/Charts
|
||||
//
|
||||
|
||||
import Foundation
|
||||
|
||||
/// Determines how to round DataSet index values for `ChartDataSet.entryIndex(x, rounding)` when an exact x-value is not found.
|
||||
@objc
|
||||
public enum ChartDataSetRounding: Int
|
||||
{
|
||||
case up = 0
|
||||
case down = 1
|
||||
case closest = 2
|
||||
}
|
||||
|
||||
/// The DataSet class represents one group or type of entries (Entry) in the Chart that belong together.
|
||||
/// It is designed to logically separate different groups of values inside the Chart (e.g. the values for a specific line in the LineChart, or the values of a specific group of bars in the BarChart).
|
||||
open class ChartDataSet: ChartBaseDataSet
|
||||
{
|
||||
public required init()
|
||||
{
|
||||
values = []
|
||||
|
||||
super.init()
|
||||
}
|
||||
|
||||
public override init(label: String?)
|
||||
{
|
||||
values = []
|
||||
|
||||
super.init(label: label)
|
||||
}
|
||||
|
||||
@objc public init(values: [ChartDataEntry]?, label: String?)
|
||||
{
|
||||
self.values = values ?? []
|
||||
|
||||
super.init(label: label)
|
||||
|
||||
self.calcMinMax()
|
||||
}
|
||||
|
||||
@objc public convenience init(values: [ChartDataEntry]?)
|
||||
{
|
||||
self.init(values: values, label: "DataSet")
|
||||
}
|
||||
|
||||
// MARK: - Data functions and accessors
|
||||
|
||||
/// *
|
||||
/// - note: Calls `notifyDataSetChanged()` after setting a new value.
|
||||
/// - returns: The array of y-values that this DataSet represents.
|
||||
/// the entries that this dataset represents / holds together
|
||||
@objc open var values: [ChartDataEntry]
|
||||
{
|
||||
didSet
|
||||
{
|
||||
if isIndirectValuesCall {
|
||||
isIndirectValuesCall = false
|
||||
return
|
||||
}
|
||||
notifyDataSetChanged()
|
||||
}
|
||||
}
|
||||
// TODO: Temporary fix for performance. Will be removed in 4.0
|
||||
private var isIndirectValuesCall = false
|
||||
|
||||
/// maximum y-value in the value array
|
||||
internal var _yMax: Double = -Double.greatestFiniteMagnitude
|
||||
|
||||
/// minimum y-value in the value array
|
||||
internal var _yMin: Double = Double.greatestFiniteMagnitude
|
||||
|
||||
/// maximum x-value in the value array
|
||||
internal var _xMax: Double = -Double.greatestFiniteMagnitude
|
||||
|
||||
/// minimum x-value in the value array
|
||||
internal var _xMin: Double = Double.greatestFiniteMagnitude
|
||||
|
||||
open override func calcMinMax()
|
||||
{
|
||||
_yMax = -Double.greatestFiniteMagnitude
|
||||
_yMin = Double.greatestFiniteMagnitude
|
||||
_xMax = -Double.greatestFiniteMagnitude
|
||||
_xMin = Double.greatestFiniteMagnitude
|
||||
|
||||
guard !values.isEmpty else { return }
|
||||
|
||||
values.forEach { calcMinMax(entry: $0) }
|
||||
}
|
||||
|
||||
open override func calcMinMaxY(fromX: Double, toX: Double)
|
||||
{
|
||||
_yMax = -Double.greatestFiniteMagnitude
|
||||
_yMin = Double.greatestFiniteMagnitude
|
||||
|
||||
guard !values.isEmpty else { return }
|
||||
|
||||
let indexFrom = entryIndex(x: fromX, closestToY: Double.nan, rounding: .down)
|
||||
let indexTo = entryIndex(x: toX, closestToY: Double.nan, rounding: .up)
|
||||
|
||||
guard !(indexTo < indexFrom) else { return }
|
||||
|
||||
(indexFrom...indexTo).forEach {
|
||||
// only recalculate y
|
||||
calcMinMaxY(entry: values[$0])
|
||||
}
|
||||
}
|
||||
|
||||
@objc open func calcMinMaxX(entry e: ChartDataEntry)
|
||||
{
|
||||
if e.x < _xMin
|
||||
{
|
||||
_xMin = e.x
|
||||
}
|
||||
if e.x > _xMax
|
||||
{
|
||||
_xMax = e.x
|
||||
}
|
||||
}
|
||||
|
||||
@objc open func calcMinMaxY(entry e: ChartDataEntry)
|
||||
{
|
||||
if e.y < _yMin
|
||||
{
|
||||
_yMin = e.y
|
||||
}
|
||||
if e.y > _yMax
|
||||
{
|
||||
_yMax = e.y
|
||||
}
|
||||
}
|
||||
|
||||
/// Updates the min and max x and y value of this DataSet based on the given Entry.
|
||||
///
|
||||
/// - parameter e:
|
||||
internal func calcMinMax(entry e: ChartDataEntry)
|
||||
{
|
||||
calcMinMaxX(entry: e)
|
||||
calcMinMaxY(entry: e)
|
||||
}
|
||||
|
||||
/// - returns: The minimum y-value this DataSet holds
|
||||
open override var yMin: Double { return _yMin }
|
||||
|
||||
/// - returns: The maximum y-value this DataSet holds
|
||||
open override var yMax: Double { return _yMax }
|
||||
|
||||
/// - returns: The minimum x-value this DataSet holds
|
||||
open override var xMin: Double { return _xMin }
|
||||
|
||||
/// - returns: The maximum x-value this DataSet holds
|
||||
open override var xMax: Double { return _xMax }
|
||||
|
||||
/// - returns: The number of y-values this DataSet represents
|
||||
open override var entryCount: Int { return values.count }
|
||||
|
||||
/// - returns: The entry object found at the given index (not x-value!)
|
||||
/// - throws: out of bounds
|
||||
/// if `i` is out of bounds, it may throw an out-of-bounds exception
|
||||
open override func entryForIndex(_ i: Int) -> ChartDataEntry?
|
||||
{
|
||||
guard i >= values.startIndex, i < values.endIndex else {
|
||||
return nil
|
||||
}
|
||||
return values[i]
|
||||
}
|
||||
|
||||
/// - returns: The first Entry object found at the given x-value with binary search.
|
||||
/// If the no Entry at the specified x-value is found, this method returns the Entry at the closest x-value according to the rounding.
|
||||
/// nil if no Entry object at that x-value.
|
||||
/// - parameter xValue: the x-value
|
||||
/// - parameter closestToY: If there are multiple y-values for the specified x-value,
|
||||
/// - parameter rounding: determine whether to round up/down/closest if there is no Entry matching the provided x-value
|
||||
open override func entryForXValue(
|
||||
_ xValue: Double,
|
||||
closestToY yValue: Double,
|
||||
rounding: ChartDataSetRounding) -> ChartDataEntry?
|
||||
{
|
||||
let index = entryIndex(x: xValue, closestToY: yValue, rounding: rounding)
|
||||
if index > -1
|
||||
{
|
||||
return values[index]
|
||||
}
|
||||
return nil
|
||||
}
|
||||
|
||||
/// - returns: The first Entry object found at the given x-value with binary search.
|
||||
/// If the no Entry at the specified x-value is found, this method returns the Entry at the closest x-value.
|
||||
/// nil if no Entry object at that x-value.
|
||||
/// - parameter xValue: the x-value
|
||||
/// - parameter closestToY: If there are multiple y-values for the specified x-value,
|
||||
open override func entryForXValue(
|
||||
_ xValue: Double,
|
||||
closestToY yValue: Double) -> ChartDataEntry?
|
||||
{
|
||||
return entryForXValue(xValue, closestToY: yValue, rounding: .closest)
|
||||
}
|
||||
|
||||
/// - returns: All Entry objects found at the given xIndex with binary search.
|
||||
/// An empty array if no Entry object at that index.
|
||||
open override func entriesForXValue(_ xValue: Double) -> [ChartDataEntry]
|
||||
{
|
||||
var entries = [ChartDataEntry]()
|
||||
|
||||
var low = values.startIndex
|
||||
var high = values.endIndex - 1
|
||||
|
||||
while low <= high
|
||||
{
|
||||
var m = (high + low) / 2
|
||||
var entry = values[m]
|
||||
|
||||
// if we have a match
|
||||
if xValue == entry.x
|
||||
{
|
||||
while m > 0 && values[m - 1].x == xValue
|
||||
{
|
||||
m -= 1
|
||||
}
|
||||
|
||||
high = values.endIndex
|
||||
|
||||
// loop over all "equal" entries
|
||||
while m < high
|
||||
{
|
||||
entry = values[m]
|
||||
if entry.x == xValue
|
||||
{
|
||||
entries.append(entry)
|
||||
}
|
||||
else
|
||||
{
|
||||
break
|
||||
}
|
||||
|
||||
m += 1
|
||||
}
|
||||
|
||||
break
|
||||
}
|
||||
else
|
||||
{
|
||||
if xValue > entry.x
|
||||
{
|
||||
low = m + 1
|
||||
}
|
||||
else
|
||||
{
|
||||
high = m - 1
|
||||
}
|
||||
}
|
||||
}
|
||||
|
||||
return entries
|
||||
}
|
||||
|
||||
/// - returns: The array-index of the specified entry.
|
||||
/// If the no Entry at the specified x-value is found, this method returns the index of the Entry at the closest x-value according to the rounding.
|
||||
///
|
||||
/// - parameter xValue: x-value of the entry to search for
|
||||
/// - parameter closestToY: If there are multiple y-values for the specified x-value,
|
||||
/// - parameter rounding: Rounding method if exact value was not found
|
||||
open override func entryIndex(
|
||||
x xValue: Double,
|
||||
closestToY yValue: Double,
|
||||
rounding: ChartDataSetRounding) -> Int
|
||||
{
|
||||
var low = values.startIndex
|
||||
var high = values.endIndex - 1
|
||||
var closest = high
|
||||
|
||||
while low < high
|
||||
{
|
||||
let m = (low + high) / 2
|
||||
|
||||
let d1 = values[m].x - xValue
|
||||
let d2 = values[m + 1].x - xValue
|
||||
let ad1 = abs(d1), ad2 = abs(d2)
|
||||
|
||||
if ad2 < ad1
|
||||
{
|
||||
// [m + 1] is closer to xValue
|
||||
// Search in an higher place
|
||||
low = m + 1
|
||||
}
|
||||
else if ad1 < ad2
|
||||
{
|
||||
// [m] is closer to xValue
|
||||
// Search in a lower place
|
||||
high = m
|
||||
}
|
||||
else
|
||||
{
|
||||
// We have multiple sequential x-value with same distance
|
||||
|
||||
if d1 >= 0.0
|
||||
{
|
||||
// Search in a lower place
|
||||
high = m
|
||||
}
|
||||
else if d1 < 0.0
|
||||
{
|
||||
// Search in an higher place
|
||||
low = m + 1
|
||||
}
|
||||
}
|
||||
|
||||
closest = high
|
||||
}
|
||||
|
||||
if closest != -1
|
||||
{
|
||||
let closestXValue = values[closest].x
|
||||
|
||||
if rounding == .up
|
||||
{
|
||||
// If rounding up, and found x-value is lower than specified x, and we can go upper...
|
||||
if closestXValue < xValue && closest < values.endIndex - 1
|
||||
{
|
||||
closest += 1
|
||||
}
|
||||
}
|
||||
else if rounding == .down
|
||||
{
|
||||
// If rounding down, and found x-value is upper than specified x, and we can go lower...
|
||||
if closestXValue > xValue && closest > 0
|
||||
{
|
||||
closest -= 1
|
||||
}
|
||||
}
|
||||
|
||||
// Search by closest to y-value
|
||||
if !yValue.isNaN
|
||||
{
|
||||
while closest > 0 && values[closest - 1].x == closestXValue
|
||||
{
|
||||
closest -= 1
|
||||
}
|
||||
|
||||
var closestYValue = values[closest].y
|
||||
var closestYIndex = closest
|
||||
|
||||
while true
|
||||
{
|
||||
closest += 1
|
||||
if closest >= values.endIndex { break }
|
||||
|
||||
let value = values[closest]
|
||||
|
||||
if value.x != closestXValue { break }
|
||||
if abs(value.y - yValue) < abs(closestYValue - yValue)
|
||||
{
|
||||
closestYValue = yValue
|
||||
closestYIndex = closest
|
||||
}
|
||||
}
|
||||
|
||||
closest = closestYIndex
|
||||
}
|
||||
}
|
||||
|
||||
return closest
|
||||
}
|
||||
|
||||
/// - returns: The array-index of the specified entry
|
||||
///
|
||||
/// - parameter e: the entry to search for
|
||||
open override func entryIndex(entry e: ChartDataEntry) -> Int
|
||||
{
|
||||
for i in 0 ..< values.count
|
||||
{
|
||||
if values[i] === e
|
||||
{
|
||||
return i
|
||||
}
|
||||
}
|
||||
|
||||
return -1
|
||||
}
|
||||
|
||||
/// Adds an Entry to the DataSet dynamically.
|
||||
/// Entries are added to the end of the list.
|
||||
/// This will also recalculate the current minimum and maximum values of the DataSet and the value-sum.
|
||||
/// - parameter e: the entry to add
|
||||
/// - returns: True
|
||||
open override func addEntry(_ e: ChartDataEntry) -> Bool
|
||||
{
|
||||
calcMinMax(entry: e)
|
||||
|
||||
isIndirectValuesCall = true
|
||||
values.append(e)
|
||||
|
||||
return true
|
||||
}
|
||||
|
||||
/// Adds an Entry to the DataSet dynamically.
|
||||
/// Entries are added to their appropriate index respective to it's x-index.
|
||||
/// This will also recalculate the current minimum and maximum values of the DataSet and the value-sum.
|
||||
/// - parameter e: the entry to add
|
||||
/// - returns: True
|
||||
open override func addEntryOrdered(_ e: ChartDataEntry) -> Bool
|
||||
{
|
||||
calcMinMax(entry: e)
|
||||
|
||||
isIndirectValuesCall = true
|
||||
if values.count > 0 && values.last!.x > e.x
|
||||
{
|
||||
var closestIndex = entryIndex(x: e.x, closestToY: e.y, rounding: .up)
|
||||
while values[closestIndex].x < e.x
|
||||
{
|
||||
closestIndex += 1
|
||||
}
|
||||
values.insert(e, at: closestIndex)
|
||||
}
|
||||
else
|
||||
{
|
||||
values.append(e)
|
||||
}
|
||||
|
||||
return true
|
||||
}
|
||||
|
||||
/// Removes an Entry from the DataSet dynamically.
|
||||
/// This will also recalculate the current minimum and maximum values of the DataSet and the value-sum.
|
||||
/// - parameter entry: the entry to remove
|
||||
/// - returns: `true` if the entry was removed successfully, else if the entry does not exist
|
||||
open override func removeEntry(_ entry: ChartDataEntry) -> Bool
|
||||
{
|
||||
var removed = false
|
||||
isIndirectValuesCall = true
|
||||
|
||||
for i in 0 ..< values.count
|
||||
{
|
||||
if values[i] === entry
|
||||
{
|
||||
values.remove(at: i)
|
||||
removed = true
|
||||
break
|
||||
}
|
||||
}
|
||||
|
||||
notifyDataSetChanged()
|
||||
|
||||
return removed
|
||||
}
|
||||
|
||||
/// Removes the first Entry (at index 0) of this DataSet from the entries array.
|
||||
///
|
||||
/// - returns: `true` if successful, `false` if not.
|
||||
open override func removeFirst() -> Bool
|
||||
{
|
||||
let entry: ChartDataEntry? = values.isEmpty ? nil : values.removeFirst()
|
||||
return entry != nil
|
||||
}
|
||||
|
||||
/// Removes the last Entry (at index size-1) of this DataSet from the entries array.
|
||||
///
|
||||
/// - returns: `true` if successful, `false` if not.
|
||||
open override func removeLast() -> Bool
|
||||
{
|
||||
let entry: ChartDataEntry? = values.isEmpty ? nil : values.removeLast()
|
||||
return entry != nil
|
||||
}
|
||||
|
||||
/// Checks if this DataSet contains the specified Entry.
|
||||
/// - returns: `true` if contains the entry, `false` if not.
|
||||
open override func contains(_ e: ChartDataEntry) -> Bool
|
||||
{
|
||||
for entry in values
|
||||
{
|
||||
if entry == e
|
||||
{
|
||||
return true
|
||||
}
|
||||
}
|
||||
|
||||
return false
|
||||
}
|
||||
|
||||
/// Removes all values from this DataSet and recalculates min and max value.
|
||||
open override func clear()
|
||||
{
|
||||
values.removeAll(keepingCapacity: true)
|
||||
}
|
||||
|
||||
// MARK: - Data functions and accessors
|
||||
|
||||
// MARK: - NSCopying
|
||||
|
||||
open override func copyWithZone(_ zone: NSZone?) -> AnyObject
|
||||
{
|
||||
let copy = super.copyWithZone(zone) as! ChartDataSet
|
||||
|
||||
copy.values = values
|
||||
copy._yMax = _yMax
|
||||
copy._yMin = _yMin
|
||||
|
||||
return copy
|
||||
}
|
||||
}
|
||||
320
Pods/Charts/Source/Charts/Data/Implementations/Standard/CombinedChartData.swift
generated
Normal file
320
Pods/Charts/Source/Charts/Data/Implementations/Standard/CombinedChartData.swift
generated
Normal file
@@ -0,0 +1,320 @@
|
||||
//
|
||||
// CombinedChartData.swift
|
||||
// Charts
|
||||
//
|
||||
// Copyright 2015 Daniel Cohen Gindi & Philipp Jahoda
|
||||
// A port of MPAndroidChart for iOS
|
||||
// Licensed under Apache License 2.0
|
||||
//
|
||||
// https://github.com/danielgindi/Charts
|
||||
//
|
||||
|
||||
import Foundation
|
||||
|
||||
open class CombinedChartData: BarLineScatterCandleBubbleChartData
|
||||
{
|
||||
private var _lineData: LineChartData!
|
||||
private var _barData: BarChartData!
|
||||
private var _scatterData: ScatterChartData!
|
||||
private var _candleData: CandleChartData!
|
||||
private var _bubbleData: BubbleChartData!
|
||||
|
||||
public override init()
|
||||
{
|
||||
super.init()
|
||||
}
|
||||
|
||||
public override init(dataSets: [IChartDataSet]?)
|
||||
{
|
||||
super.init(dataSets: dataSets)
|
||||
}
|
||||
|
||||
@objc open var lineData: LineChartData!
|
||||
{
|
||||
get
|
||||
{
|
||||
return _lineData
|
||||
}
|
||||
set
|
||||
{
|
||||
_lineData = newValue
|
||||
notifyDataChanged()
|
||||
}
|
||||
}
|
||||
|
||||
@objc open var barData: BarChartData!
|
||||
{
|
||||
get
|
||||
{
|
||||
return _barData
|
||||
}
|
||||
set
|
||||
{
|
||||
_barData = newValue
|
||||
notifyDataChanged()
|
||||
}
|
||||
}
|
||||
|
||||
@objc open var scatterData: ScatterChartData!
|
||||
{
|
||||
get
|
||||
{
|
||||
return _scatterData
|
||||
}
|
||||
set
|
||||
{
|
||||
_scatterData = newValue
|
||||
notifyDataChanged()
|
||||
}
|
||||
}
|
||||
|
||||
@objc open var candleData: CandleChartData!
|
||||
{
|
||||
get
|
||||
{
|
||||
return _candleData
|
||||
}
|
||||
set
|
||||
{
|
||||
_candleData = newValue
|
||||
notifyDataChanged()
|
||||
}
|
||||
}
|
||||
|
||||
@objc open var bubbleData: BubbleChartData!
|
||||
{
|
||||
get
|
||||
{
|
||||
return _bubbleData
|
||||
}
|
||||
set
|
||||
{
|
||||
_bubbleData = newValue
|
||||
notifyDataChanged()
|
||||
}
|
||||
}
|
||||
|
||||
open override func calcMinMax()
|
||||
{
|
||||
_dataSets.removeAll()
|
||||
|
||||
_yMax = -Double.greatestFiniteMagnitude
|
||||
_yMin = Double.greatestFiniteMagnitude
|
||||
_xMax = -Double.greatestFiniteMagnitude
|
||||
_xMin = Double.greatestFiniteMagnitude
|
||||
|
||||
_leftAxisMax = -Double.greatestFiniteMagnitude
|
||||
_leftAxisMin = Double.greatestFiniteMagnitude
|
||||
_rightAxisMax = -Double.greatestFiniteMagnitude
|
||||
_rightAxisMin = Double.greatestFiniteMagnitude
|
||||
|
||||
let allData = self.allData
|
||||
|
||||
for data in allData
|
||||
{
|
||||
data.calcMinMax()
|
||||
|
||||
let sets = data.dataSets
|
||||
_dataSets.append(contentsOf: sets)
|
||||
|
||||
if data.yMax > _yMax
|
||||
{
|
||||
_yMax = data.yMax
|
||||
}
|
||||
|
||||
if data.yMin < _yMin
|
||||
{
|
||||
_yMin = data.yMin
|
||||
}
|
||||
|
||||
if data.xMax > _xMax
|
||||
{
|
||||
_xMax = data.xMax
|
||||
}
|
||||
|
||||
if data.xMin < _xMin
|
||||
{
|
||||
_xMin = data.xMin
|
||||
}
|
||||
|
||||
for dataset in sets
|
||||
{
|
||||
if dataset.axisDependency == .left
|
||||
{
|
||||
if dataset.yMax > _leftAxisMax
|
||||
{
|
||||
_leftAxisMax = dataset.yMax
|
||||
}
|
||||
if dataset.yMin < _leftAxisMin
|
||||
{
|
||||
_leftAxisMin = dataset.yMin
|
||||
}
|
||||
}
|
||||
else
|
||||
{
|
||||
if dataset.yMax > _rightAxisMax
|
||||
{
|
||||
_rightAxisMax = dataset.yMax
|
||||
}
|
||||
if dataset.yMin < _rightAxisMin
|
||||
{
|
||||
_rightAxisMin = dataset.yMin
|
||||
}
|
||||
}
|
||||
}
|
||||
}
|
||||
}
|
||||
|
||||
/// - returns: All data objects in row: line-bar-scatter-candle-bubble if not null.
|
||||
@objc open var allData: [ChartData]
|
||||
{
|
||||
var data = [ChartData]()
|
||||
|
||||
if lineData !== nil
|
||||
{
|
||||
data.append(lineData)
|
||||
}
|
||||
if barData !== nil
|
||||
{
|
||||
data.append(barData)
|
||||
}
|
||||
if scatterData !== nil
|
||||
{
|
||||
data.append(scatterData)
|
||||
}
|
||||
if candleData !== nil
|
||||
{
|
||||
data.append(candleData)
|
||||
}
|
||||
if bubbleData !== nil
|
||||
{
|
||||
data.append(bubbleData)
|
||||
}
|
||||
|
||||
return data
|
||||
}
|
||||
|
||||
@objc open func dataByIndex(_ index: Int) -> ChartData
|
||||
{
|
||||
return allData[index]
|
||||
}
|
||||
|
||||
open func dataIndex(_ data: ChartData) -> Int?
|
||||
{
|
||||
return allData.index(of: data)
|
||||
}
|
||||
|
||||
open override func removeDataSet(_ dataSet: IChartDataSet!) -> Bool
|
||||
{
|
||||
let datas = allData
|
||||
|
||||
var success = false
|
||||
|
||||
for data in datas
|
||||
{
|
||||
success = data.removeDataSet(dataSet)
|
||||
|
||||
if success
|
||||
{
|
||||
break
|
||||
}
|
||||
}
|
||||
|
||||
return success
|
||||
}
|
||||
|
||||
open override func removeDataSetByIndex(_ index: Int) -> Bool
|
||||
{
|
||||
print("removeDataSet(index) not supported for CombinedData", terminator: "\n")
|
||||
return false
|
||||
}
|
||||
|
||||
open override func removeEntry(_ entry: ChartDataEntry, dataSetIndex: Int) -> Bool
|
||||
{
|
||||
print("removeEntry(entry, dataSetIndex) not supported for CombinedData", terminator: "\n")
|
||||
return false
|
||||
}
|
||||
|
||||
open override func removeEntry(xValue: Double, dataSetIndex: Int) -> Bool
|
||||
{
|
||||
print("removeEntry(xValue, dataSetIndex) not supported for CombinedData", terminator: "\n")
|
||||
return false
|
||||
}
|
||||
|
||||
open override func notifyDataChanged()
|
||||
{
|
||||
if _lineData !== nil
|
||||
{
|
||||
_lineData.notifyDataChanged()
|
||||
}
|
||||
if _barData !== nil
|
||||
{
|
||||
_barData.notifyDataChanged()
|
||||
}
|
||||
if _scatterData !== nil
|
||||
{
|
||||
_scatterData.notifyDataChanged()
|
||||
}
|
||||
if _candleData !== nil
|
||||
{
|
||||
_candleData.notifyDataChanged()
|
||||
}
|
||||
if _bubbleData !== nil
|
||||
{
|
||||
_bubbleData.notifyDataChanged()
|
||||
}
|
||||
|
||||
super.notifyDataChanged() // recalculate everything
|
||||
}
|
||||
|
||||
/// Get the Entry for a corresponding highlight object
|
||||
///
|
||||
/// - parameter highlight:
|
||||
/// - returns: The entry that is highlighted
|
||||
open override func entryForHighlight(_ highlight: Highlight) -> ChartDataEntry?
|
||||
{
|
||||
if highlight.dataIndex >= allData.count
|
||||
{
|
||||
return nil
|
||||
}
|
||||
|
||||
let data = dataByIndex(highlight.dataIndex)
|
||||
|
||||
if highlight.dataSetIndex >= data.dataSetCount
|
||||
{
|
||||
return nil
|
||||
}
|
||||
|
||||
// The value of the highlighted entry could be NaN - if we are not interested in highlighting a specific value.
|
||||
let entries = data.getDataSetByIndex(highlight.dataSetIndex).entriesForXValue(highlight.x)
|
||||
for e in entries
|
||||
{
|
||||
if e.y == highlight.y || highlight.y.isNaN
|
||||
{
|
||||
return e
|
||||
}
|
||||
}
|
||||
return nil
|
||||
}
|
||||
|
||||
/// Get dataset for highlight
|
||||
///
|
||||
/// - Parameter highlight: current highlight
|
||||
/// - Returns: dataset related to highlight
|
||||
@objc open func getDataSetByHighlight(_ highlight: Highlight) -> IChartDataSet!
|
||||
{
|
||||
if highlight.dataIndex >= allData.count
|
||||
{
|
||||
return nil
|
||||
}
|
||||
|
||||
let data = dataByIndex(highlight.dataIndex)
|
||||
|
||||
if highlight.dataSetIndex >= data.dataSetCount
|
||||
{
|
||||
return nil
|
||||
}
|
||||
|
||||
return data.dataSets[highlight.dataSetIndex]
|
||||
}
|
||||
}
|
||||
26
Pods/Charts/Source/Charts/Data/Implementations/Standard/LineChartData.swift
generated
Normal file
26
Pods/Charts/Source/Charts/Data/Implementations/Standard/LineChartData.swift
generated
Normal file
@@ -0,0 +1,26 @@
|
||||
//
|
||||
// LineChartData.swift
|
||||
// Charts
|
||||
//
|
||||
// Copyright 2015 Daniel Cohen Gindi & Philipp Jahoda
|
||||
// A port of MPAndroidChart for iOS
|
||||
// Licensed under Apache License 2.0
|
||||
//
|
||||
// https://github.com/danielgindi/Charts
|
||||
//
|
||||
|
||||
import Foundation
|
||||
|
||||
/// Data object that encapsulates all data associated with a LineChart.
|
||||
open class LineChartData: ChartData
|
||||
{
|
||||
public override init()
|
||||
{
|
||||
super.init()
|
||||
}
|
||||
|
||||
public override init(dataSets: [IChartDataSet]?)
|
||||
{
|
||||
super.init(dataSets: dataSets)
|
||||
}
|
||||
}
|
||||
178
Pods/Charts/Source/Charts/Data/Implementations/Standard/LineChartDataSet.swift
generated
Normal file
178
Pods/Charts/Source/Charts/Data/Implementations/Standard/LineChartDataSet.swift
generated
Normal file
@@ -0,0 +1,178 @@
|
||||
//
|
||||
// LineChartDataSet.swift
|
||||
// Charts
|
||||
//
|
||||
// Copyright 2015 Daniel Cohen Gindi & Philipp Jahoda
|
||||
// A port of MPAndroidChart for iOS
|
||||
// Licensed under Apache License 2.0
|
||||
//
|
||||
// https://github.com/danielgindi/Charts
|
||||
//
|
||||
|
||||
import Foundation
|
||||
import CoreGraphics
|
||||
|
||||
|
||||
open class LineChartDataSet: LineRadarChartDataSet, ILineChartDataSet
|
||||
{
|
||||
@objc(LineChartMode)
|
||||
public enum Mode: Int
|
||||
{
|
||||
case linear
|
||||
case stepped
|
||||
case cubicBezier
|
||||
case horizontalBezier
|
||||
}
|
||||
|
||||
private func initialize()
|
||||
{
|
||||
// default color
|
||||
circleColors.append(NSUIColor(red: 140.0/255.0, green: 234.0/255.0, blue: 255.0/255.0, alpha: 1.0))
|
||||
}
|
||||
|
||||
public required init()
|
||||
{
|
||||
super.init()
|
||||
initialize()
|
||||
}
|
||||
|
||||
public override init(values: [ChartDataEntry]?, label: String?)
|
||||
{
|
||||
super.init(values: values, label: label)
|
||||
initialize()
|
||||
}
|
||||
|
||||
// MARK: - Data functions and accessors
|
||||
|
||||
// MARK: - Styling functions and accessors
|
||||
|
||||
/// The drawing mode for this line dataset
|
||||
///
|
||||
/// **default**: Linear
|
||||
open var mode: Mode = Mode.linear
|
||||
|
||||
private var _cubicIntensity = CGFloat(0.2)
|
||||
|
||||
/// Intensity for cubic lines (min = 0.05, max = 1)
|
||||
///
|
||||
/// **default**: 0.2
|
||||
open var cubicIntensity: CGFloat
|
||||
{
|
||||
get
|
||||
{
|
||||
return _cubicIntensity
|
||||
}
|
||||
set
|
||||
{
|
||||
_cubicIntensity = newValue
|
||||
if _cubicIntensity > 1.0
|
||||
{
|
||||
_cubicIntensity = 1.0
|
||||
}
|
||||
if _cubicIntensity < 0.05
|
||||
{
|
||||
_cubicIntensity = 0.05
|
||||
}
|
||||
}
|
||||
}
|
||||
|
||||
/// The radius of the drawn circles.
|
||||
open var circleRadius = CGFloat(8.0)
|
||||
|
||||
/// The hole radius of the drawn circles
|
||||
open var circleHoleRadius = CGFloat(4.0)
|
||||
|
||||
open var circleColors = [NSUIColor]()
|
||||
|
||||
/// - returns: The color at the given index of the DataSet's circle-color array.
|
||||
/// Performs a IndexOutOfBounds check by modulus.
|
||||
open func getCircleColor(atIndex index: Int) -> NSUIColor?
|
||||
{
|
||||
let size = circleColors.count
|
||||
let index = index % size
|
||||
if index >= size
|
||||
{
|
||||
return nil
|
||||
}
|
||||
return circleColors[index]
|
||||
}
|
||||
|
||||
/// Sets the one and ONLY color that should be used for this DataSet.
|
||||
/// Internally, this recreates the colors array and adds the specified color.
|
||||
open func setCircleColor(_ color: NSUIColor)
|
||||
{
|
||||
circleColors.removeAll(keepingCapacity: false)
|
||||
circleColors.append(color)
|
||||
}
|
||||
|
||||
open func setCircleColors(_ colors: NSUIColor...)
|
||||
{
|
||||
circleColors.removeAll(keepingCapacity: false)
|
||||
circleColors.append(contentsOf: colors)
|
||||
}
|
||||
|
||||
/// Resets the circle-colors array and creates a new one
|
||||
open func resetCircleColors(_ index: Int)
|
||||
{
|
||||
circleColors.removeAll(keepingCapacity: false)
|
||||
}
|
||||
|
||||
/// If true, drawing circles is enabled
|
||||
open var drawCirclesEnabled = true
|
||||
|
||||
/// - returns: `true` if drawing circles for this DataSet is enabled, `false` ifnot
|
||||
open var isDrawCirclesEnabled: Bool { return drawCirclesEnabled }
|
||||
|
||||
/// The color of the inner circle (the circle-hole).
|
||||
open var circleHoleColor: NSUIColor? = NSUIColor.white
|
||||
|
||||
/// `true` if drawing circles for this DataSet is enabled, `false` ifnot
|
||||
open var drawCircleHoleEnabled = true
|
||||
|
||||
/// - returns: `true` if drawing the circle-holes is enabled, `false` ifnot.
|
||||
open var isDrawCircleHoleEnabled: Bool { return drawCircleHoleEnabled }
|
||||
|
||||
/// This is how much (in pixels) into the dash pattern are we starting from.
|
||||
open var lineDashPhase = CGFloat(0.0)
|
||||
|
||||
/// This is the actual dash pattern.
|
||||
/// I.e. [2, 3] will paint [-- -- ]
|
||||
/// [1, 3, 4, 2] will paint [- ---- - ---- ]
|
||||
open var lineDashLengths: [CGFloat]?
|
||||
|
||||
/// Line cap type, default is CGLineCap.Butt
|
||||
open var lineCapType = CGLineCap.butt
|
||||
|
||||
/// formatter for customizing the position of the fill-line
|
||||
private var _fillFormatter: IFillFormatter = DefaultFillFormatter()
|
||||
|
||||
/// Sets a custom IFillFormatter to the chart that handles the position of the filled-line for each DataSet. Set this to null to use the default logic.
|
||||
open var fillFormatter: IFillFormatter?
|
||||
{
|
||||
get
|
||||
{
|
||||
return _fillFormatter
|
||||
}
|
||||
set
|
||||
{
|
||||
_fillFormatter = newValue ?? DefaultFillFormatter()
|
||||
}
|
||||
}
|
||||
|
||||
// MARK: NSCopying
|
||||
|
||||
open override func copyWithZone(_ zone: NSZone?) -> AnyObject
|
||||
{
|
||||
let copy = super.copyWithZone(zone) as! LineChartDataSet
|
||||
copy.circleColors = circleColors
|
||||
copy.circleRadius = circleRadius
|
||||
copy.cubicIntensity = cubicIntensity
|
||||
copy.lineDashPhase = lineDashPhase
|
||||
copy.lineDashLengths = lineDashLengths
|
||||
copy.lineCapType = lineCapType
|
||||
copy.drawCirclesEnabled = drawCirclesEnabled
|
||||
copy.drawCircleHoleEnabled = drawCircleHoleEnabled
|
||||
copy.mode = mode
|
||||
return copy
|
||||
}
|
||||
}
|
||||
94
Pods/Charts/Source/Charts/Data/Implementations/Standard/LineRadarChartDataSet.swift
generated
Normal file
94
Pods/Charts/Source/Charts/Data/Implementations/Standard/LineRadarChartDataSet.swift
generated
Normal file
@@ -0,0 +1,94 @@
|
||||
//
|
||||
// LineRadarChartDataSet.swift
|
||||
// Charts
|
||||
//
|
||||
// Copyright 2015 Daniel Cohen Gindi & Philipp Jahoda
|
||||
// A port of MPAndroidChart for iOS
|
||||
// Licensed under Apache License 2.0
|
||||
//
|
||||
// https://github.com/danielgindi/Charts
|
||||
//
|
||||
|
||||
import Foundation
|
||||
import CoreGraphics
|
||||
|
||||
|
||||
open class LineRadarChartDataSet: LineScatterCandleRadarChartDataSet, ILineRadarChartDataSet
|
||||
{
|
||||
// MARK: - Data functions and accessors
|
||||
|
||||
// MARK: - Styling functions and accessors
|
||||
|
||||
/// The color that is used for filling the line surface area.
|
||||
private var _fillColor = NSUIColor(red: 140.0/255.0, green: 234.0/255.0, blue: 255.0/255.0, alpha: 1.0)
|
||||
|
||||
/// The color that is used for filling the line surface area.
|
||||
open var fillColor: NSUIColor
|
||||
{
|
||||
get { return _fillColor }
|
||||
set
|
||||
{
|
||||
_fillColor = newValue
|
||||
fill = nil
|
||||
}
|
||||
}
|
||||
|
||||
/// The object that is used for filling the area below the line.
|
||||
/// **default**: nil
|
||||
open var fill: Fill?
|
||||
|
||||
/// The alpha value that is used for filling the line surface,
|
||||
/// **default**: 0.33
|
||||
open var fillAlpha = CGFloat(0.33)
|
||||
|
||||
private var _lineWidth = CGFloat(1.0)
|
||||
|
||||
/// line width of the chart (min = 0.0, max = 10)
|
||||
///
|
||||
/// **default**: 1
|
||||
open var lineWidth: CGFloat
|
||||
{
|
||||
get
|
||||
{
|
||||
return _lineWidth
|
||||
}
|
||||
set
|
||||
{
|
||||
if newValue < 0.0
|
||||
{
|
||||
_lineWidth = 0.0
|
||||
}
|
||||
else if newValue > 10.0
|
||||
{
|
||||
_lineWidth = 10.0
|
||||
}
|
||||
else
|
||||
{
|
||||
_lineWidth = newValue
|
||||
}
|
||||
}
|
||||
}
|
||||
|
||||
/// Set to `true` if the DataSet should be drawn filled (surface), and not just as a line.
|
||||
/// Disabling this will give great performance boost.
|
||||
/// Please note that this method uses the path clipping for drawing the filled area (with images, gradients and layers).
|
||||
open var drawFilledEnabled = false
|
||||
|
||||
/// - returns: `true` if filled drawing is enabled, `false` ifnot
|
||||
open var isDrawFilledEnabled: Bool
|
||||
{
|
||||
return drawFilledEnabled
|
||||
}
|
||||
|
||||
// MARK: NSCopying
|
||||
|
||||
open override func copyWithZone(_ zone: NSZone?) -> AnyObject
|
||||
{
|
||||
let copy = super.copyWithZone(zone) as! LineRadarChartDataSet
|
||||
copy.fillColor = fillColor
|
||||
copy._lineWidth = _lineWidth
|
||||
copy.drawFilledEnabled = drawFilledEnabled
|
||||
return copy
|
||||
}
|
||||
|
||||
}
|
||||
51
Pods/Charts/Source/Charts/Data/Implementations/Standard/LineScatterCandleRadarChartDataSet.swift
generated
Normal file
51
Pods/Charts/Source/Charts/Data/Implementations/Standard/LineScatterCandleRadarChartDataSet.swift
generated
Normal file
@@ -0,0 +1,51 @@
|
||||
//
|
||||
// LineScatterCandleRadarChartDataSet.swift
|
||||
// Charts
|
||||
//
|
||||
// Copyright 2015 Daniel Cohen Gindi & Philipp Jahoda
|
||||
// A port of MPAndroidChart for iOS
|
||||
// Licensed under Apache License 2.0
|
||||
//
|
||||
// https://github.com/danielgindi/Charts
|
||||
//
|
||||
|
||||
import Foundation
|
||||
|
||||
|
||||
open class LineScatterCandleRadarChartDataSet: BarLineScatterCandleBubbleChartDataSet, ILineScatterCandleRadarChartDataSet
|
||||
{
|
||||
// MARK: - Data functions and accessors
|
||||
|
||||
// MARK: - Styling functions and accessors
|
||||
|
||||
/// Enables / disables the horizontal highlight-indicator. If disabled, the indicator is not drawn.
|
||||
open var drawHorizontalHighlightIndicatorEnabled = true
|
||||
|
||||
/// Enables / disables the vertical highlight-indicator. If disabled, the indicator is not drawn.
|
||||
open var drawVerticalHighlightIndicatorEnabled = true
|
||||
|
||||
/// - returns: `true` if horizontal highlight indicator lines are enabled (drawn)
|
||||
open var isHorizontalHighlightIndicatorEnabled: Bool { return drawHorizontalHighlightIndicatorEnabled }
|
||||
|
||||
/// - returns: `true` if vertical highlight indicator lines are enabled (drawn)
|
||||
open var isVerticalHighlightIndicatorEnabled: Bool { return drawVerticalHighlightIndicatorEnabled }
|
||||
|
||||
/// Enables / disables both vertical and horizontal highlight-indicators.
|
||||
/// :param: enabled
|
||||
open func setDrawHighlightIndicators(_ enabled: Bool)
|
||||
{
|
||||
drawHorizontalHighlightIndicatorEnabled = enabled
|
||||
drawVerticalHighlightIndicatorEnabled = enabled
|
||||
}
|
||||
|
||||
// MARK: NSCopying
|
||||
|
||||
open override func copyWithZone(_ zone: NSZone?) -> AnyObject
|
||||
{
|
||||
let copy = super.copyWithZone(zone) as! LineScatterCandleRadarChartDataSet
|
||||
copy.drawHorizontalHighlightIndicatorEnabled = drawHorizontalHighlightIndicatorEnabled
|
||||
copy.drawVerticalHighlightIndicatorEnabled = drawVerticalHighlightIndicatorEnabled
|
||||
return copy
|
||||
}
|
||||
|
||||
}
|
||||
130
Pods/Charts/Source/Charts/Data/Implementations/Standard/PieChartData.swift
generated
Normal file
130
Pods/Charts/Source/Charts/Data/Implementations/Standard/PieChartData.swift
generated
Normal file
@@ -0,0 +1,130 @@
|
||||
//
|
||||
// PieData.swift
|
||||
// Charts
|
||||
//
|
||||
// Copyright 2015 Daniel Cohen Gindi & Philipp Jahoda
|
||||
// A port of MPAndroidChart for iOS
|
||||
// Licensed under Apache License 2.0
|
||||
//
|
||||
// https://github.com/danielgindi/Charts
|
||||
//
|
||||
|
||||
import Foundation
|
||||
|
||||
open class PieChartData: ChartData
|
||||
{
|
||||
public override init()
|
||||
{
|
||||
super.init()
|
||||
}
|
||||
|
||||
public override init(dataSets: [IChartDataSet]?)
|
||||
{
|
||||
super.init(dataSets: dataSets)
|
||||
}
|
||||
|
||||
/// - returns: All DataSet objects this ChartData object holds.
|
||||
@objc open override var dataSets: [IChartDataSet]
|
||||
{
|
||||
get
|
||||
{
|
||||
assert(super.dataSets.count <= 1, "Found multiple data sets while pie chart only allows one")
|
||||
return super.dataSets
|
||||
}
|
||||
set
|
||||
{
|
||||
super.dataSets = newValue
|
||||
}
|
||||
}
|
||||
|
||||
@objc var dataSet: IPieChartDataSet?
|
||||
{
|
||||
get
|
||||
{
|
||||
return dataSets.count > 0 ? dataSets[0] as? IPieChartDataSet : nil
|
||||
}
|
||||
set
|
||||
{
|
||||
if let newValue = newValue
|
||||
{
|
||||
dataSets = [newValue]
|
||||
}
|
||||
else
|
||||
{
|
||||
dataSets = []
|
||||
}
|
||||
}
|
||||
}
|
||||
|
||||
open override func getDataSetByIndex(_ index: Int) -> IChartDataSet?
|
||||
{
|
||||
if index != 0
|
||||
{
|
||||
return nil
|
||||
}
|
||||
return super.getDataSetByIndex(index)
|
||||
}
|
||||
|
||||
open override func getDataSetByLabel(_ label: String, ignorecase: Bool) -> IChartDataSet?
|
||||
{
|
||||
if dataSets.count == 0 || dataSets[0].label == nil
|
||||
{
|
||||
return nil
|
||||
}
|
||||
|
||||
if ignorecase
|
||||
{
|
||||
if let label = dataSets[0].label, label.caseInsensitiveCompare(label) == .orderedSame
|
||||
{
|
||||
return dataSets[0]
|
||||
}
|
||||
}
|
||||
else
|
||||
{
|
||||
if label == dataSets[0].label
|
||||
{
|
||||
return dataSets[0]
|
||||
}
|
||||
}
|
||||
return nil
|
||||
}
|
||||
|
||||
open override func entryForHighlight(_ highlight: Highlight) -> ChartDataEntry?
|
||||
{
|
||||
return dataSet?.entryForIndex(Int(highlight.x))
|
||||
}
|
||||
|
||||
open override func addDataSet(_ d: IChartDataSet!)
|
||||
{
|
||||
super.addDataSet(d)
|
||||
}
|
||||
|
||||
/// Removes the DataSet at the given index in the DataSet array from the data object.
|
||||
/// Also recalculates all minimum and maximum values.
|
||||
///
|
||||
/// - returns: `true` if a DataSet was removed, `false` ifno DataSet could be removed.
|
||||
open override func removeDataSetByIndex(_ index: Int) -> Bool
|
||||
{
|
||||
if index >= _dataSets.count || index < 0
|
||||
{
|
||||
return false
|
||||
}
|
||||
|
||||
return false
|
||||
}
|
||||
|
||||
/// - returns: The total y-value sum across all DataSet objects the this object represents.
|
||||
@objc open var yValueSum: Double
|
||||
{
|
||||
guard let dataSet = dataSet else { return 0.0 }
|
||||
|
||||
var yValueSum: Double = 0.0
|
||||
|
||||
for i in 0..<dataSet.entryCount
|
||||
{
|
||||
yValueSum += dataSet.entryForIndex(i)?.y ?? 0.0
|
||||
}
|
||||
|
||||
return yValueSum
|
||||
}
|
||||
}
|
||||
102
Pods/Charts/Source/Charts/Data/Implementations/Standard/PieChartDataEntry.swift
generated
Normal file
102
Pods/Charts/Source/Charts/Data/Implementations/Standard/PieChartDataEntry.swift
generated
Normal file
@@ -0,0 +1,102 @@
|
||||
//
|
||||
// PieChartDataEntry.swift
|
||||
// Charts
|
||||
//
|
||||
// Copyright 2015 Daniel Cohen Gindi & Philipp Jahoda
|
||||
// A port of MPAndroidChart for iOS
|
||||
// Licensed under Apache License 2.0
|
||||
//
|
||||
// https://github.com/danielgindi/Charts
|
||||
//
|
||||
|
||||
import Foundation
|
||||
import CoreGraphics
|
||||
|
||||
open class PieChartDataEntry: ChartDataEntry
|
||||
{
|
||||
public required init()
|
||||
{
|
||||
super.init()
|
||||
}
|
||||
|
||||
/// - parameter value: The value on the y-axis
|
||||
/// - parameter label: The label for the x-axis
|
||||
@objc public convenience init(value: Double, label: String?)
|
||||
{
|
||||
self.init(value: value, label: label, icon: nil, data: nil)
|
||||
}
|
||||
|
||||
/// - parameter value: The value on the y-axis
|
||||
/// - parameter label: The label for the x-axis
|
||||
/// - parameter data: Spot for additional data this Entry represents
|
||||
@objc public convenience init(value: Double, label: String?, data: AnyObject?)
|
||||
{
|
||||
self.init(value: value, label: label, icon: nil, data: data)
|
||||
}
|
||||
|
||||
/// - parameter value: The value on the y-axis
|
||||
/// - parameter label: The label for the x-axis
|
||||
/// - parameter icon: icon image
|
||||
@objc public convenience init(value: Double, label: String?, icon: NSUIImage?)
|
||||
{
|
||||
self.init(value: value, label: label, icon: icon, data: nil)
|
||||
}
|
||||
|
||||
/// - parameter value: The value on the y-axis
|
||||
/// - parameter label: The label for the x-axis
|
||||
/// - parameter icon: icon image
|
||||
/// - parameter data: Spot for additional data this Entry represents
|
||||
@objc public init(value: Double, label: String?, icon: NSUIImage?, data: AnyObject?)
|
||||
{
|
||||
super.init(x: 0.0, y: value, icon: icon, data: data)
|
||||
|
||||
self.label = label
|
||||
}
|
||||
|
||||
/// - parameter value: The value on the y-axis
|
||||
@objc public convenience init(value: Double)
|
||||
{
|
||||
self.init(value: value, label: nil, icon: nil, data: nil)
|
||||
}
|
||||
|
||||
/// - parameter value: The value on the y-axis
|
||||
/// - parameter data: Spot for additional data this Entry represents
|
||||
@objc public convenience init(value: Double, data: AnyObject?)
|
||||
{
|
||||
self.init(value: value, label: nil, icon: nil, data: data)
|
||||
}
|
||||
|
||||
/// - parameter value: The value on the y-axis
|
||||
/// - parameter icon: icon image
|
||||
@objc public convenience init(value: Double, icon: NSUIImage?)
|
||||
{
|
||||
self.init(value: value, label: nil, icon: icon, data: nil)
|
||||
}
|
||||
|
||||
/// - parameter value: The value on the y-axis
|
||||
/// - parameter icon: icon image
|
||||
/// - parameter data: Spot for additional data this Entry represents
|
||||
@objc public convenience init(value: Double, icon: NSUIImage?, data: AnyObject?)
|
||||
{
|
||||
self.init(value: value, label: nil, icon: icon, data: data)
|
||||
}
|
||||
|
||||
// MARK: Data property accessors
|
||||
|
||||
@objc open var label: String?
|
||||
|
||||
@objc open var value: Double
|
||||
{
|
||||
get { return y }
|
||||
set { y = newValue }
|
||||
}
|
||||
|
||||
// MARK: NSCopying
|
||||
|
||||
open override func copyWithZone(_ zone: NSZone?) -> AnyObject
|
||||
{
|
||||
let copy = super.copyWithZone(zone) as! PieChartDataEntry
|
||||
copy.label = label
|
||||
return copy
|
||||
}
|
||||
}
|
||||
121
Pods/Charts/Source/Charts/Data/Implementations/Standard/PieChartDataSet.swift
generated
Normal file
121
Pods/Charts/Source/Charts/Data/Implementations/Standard/PieChartDataSet.swift
generated
Normal file
@@ -0,0 +1,121 @@
|
||||
//
|
||||
// PieChartDataSet.swift
|
||||
// Charts
|
||||
//
|
||||
// Copyright 2015 Daniel Cohen Gindi & Philipp Jahoda
|
||||
// A port of MPAndroidChart for iOS
|
||||
// Licensed under Apache License 2.0
|
||||
//
|
||||
// https://github.com/danielgindi/Charts
|
||||
//
|
||||
|
||||
import Foundation
|
||||
import CoreGraphics
|
||||
|
||||
open class PieChartDataSet: ChartDataSet, IPieChartDataSet
|
||||
{
|
||||
@objc(PieChartValuePosition)
|
||||
public enum ValuePosition: Int
|
||||
{
|
||||
case insideSlice
|
||||
case outsideSlice
|
||||
}
|
||||
|
||||
private func initialize()
|
||||
{
|
||||
self.valueTextColor = NSUIColor.white
|
||||
self.valueFont = NSUIFont.systemFont(ofSize: 13.0)
|
||||
}
|
||||
|
||||
public required init()
|
||||
{
|
||||
super.init()
|
||||
initialize()
|
||||
}
|
||||
|
||||
public override init(values: [ChartDataEntry]?, label: String?)
|
||||
{
|
||||
super.init(values: values, label: label)
|
||||
initialize()
|
||||
}
|
||||
|
||||
internal override func calcMinMax(entry e: ChartDataEntry)
|
||||
{
|
||||
calcMinMaxY(entry: e)
|
||||
}
|
||||
|
||||
// MARK: - Styling functions and accessors
|
||||
|
||||
private var _sliceSpace = CGFloat(0.0)
|
||||
|
||||
/// the space in pixels between the pie-slices
|
||||
/// **default**: 0
|
||||
/// **maximum**: 20
|
||||
open var sliceSpace: CGFloat
|
||||
{
|
||||
get
|
||||
{
|
||||
return _sliceSpace
|
||||
}
|
||||
set
|
||||
{
|
||||
var space = newValue
|
||||
if space > 20.0
|
||||
{
|
||||
space = 20.0
|
||||
}
|
||||
if space < 0.0
|
||||
{
|
||||
space = 0.0
|
||||
}
|
||||
_sliceSpace = space
|
||||
}
|
||||
}
|
||||
|
||||
/// When enabled, slice spacing will be 0.0 when the smallest value is going to be smaller than the slice spacing itself.
|
||||
open var automaticallyDisableSliceSpacing: Bool = false
|
||||
|
||||
/// indicates the selection distance of a pie slice
|
||||
open var selectionShift = CGFloat(18.0)
|
||||
|
||||
open var xValuePosition: ValuePosition = .insideSlice
|
||||
open var yValuePosition: ValuePosition = .insideSlice
|
||||
|
||||
/// When valuePosition is OutsideSlice, indicates line color
|
||||
open var valueLineColor: NSUIColor? = NSUIColor.black
|
||||
|
||||
/// When valuePosition is OutsideSlice, indicates line width
|
||||
open var valueLineWidth: CGFloat = 1.0
|
||||
|
||||
/// When valuePosition is OutsideSlice, indicates offset as percentage out of the slice size
|
||||
open var valueLinePart1OffsetPercentage: CGFloat = 0.75
|
||||
|
||||
/// When valuePosition is OutsideSlice, indicates length of first half of the line
|
||||
open var valueLinePart1Length: CGFloat = 0.3
|
||||
|
||||
/// When valuePosition is OutsideSlice, indicates length of second half of the line
|
||||
open var valueLinePart2Length: CGFloat = 0.4
|
||||
|
||||
/// When valuePosition is OutsideSlice, this allows variable line length
|
||||
open var valueLineVariableLength: Bool = true
|
||||
|
||||
/// the font for the slice-text labels
|
||||
open var entryLabelFont: NSUIFont? = nil
|
||||
|
||||
/// the color for the slice-text labels
|
||||
open var entryLabelColor: NSUIColor? = nil
|
||||
|
||||
/// the color for the highlighted sector
|
||||
open var highlightColor: NSUIColor? = nil
|
||||
|
||||
// MARK: - NSCopying
|
||||
|
||||
open override func copyWithZone(_ zone: NSZone?) -> AnyObject
|
||||
{
|
||||
let copy = super.copyWithZone(zone) as! PieChartDataSet
|
||||
copy._sliceSpace = _sliceSpace
|
||||
copy.selectionShift = selectionShift
|
||||
copy.highlightColor = highlightColor
|
||||
return copy
|
||||
}
|
||||
}
|
||||
46
Pods/Charts/Source/Charts/Data/Implementations/Standard/RadarChartData.swift
generated
Normal file
46
Pods/Charts/Source/Charts/Data/Implementations/Standard/RadarChartData.swift
generated
Normal file
@@ -0,0 +1,46 @@
|
||||
//
|
||||
// RadarChartData.swift
|
||||
// Charts
|
||||
//
|
||||
// Copyright 2015 Daniel Cohen Gindi & Philipp Jahoda
|
||||
// A port of MPAndroidChart for iOS
|
||||
// Licensed under Apache License 2.0
|
||||
//
|
||||
// https://github.com/danielgindi/Charts
|
||||
//
|
||||
|
||||
import Foundation
|
||||
import CoreGraphics
|
||||
|
||||
|
||||
open class RadarChartData: ChartData
|
||||
{
|
||||
@objc open var highlightColor = NSUIColor(red: 255.0/255.0, green: 187.0/255.0, blue: 115.0/255.0, alpha: 1.0)
|
||||
@objc open var highlightLineWidth = CGFloat(1.0)
|
||||
@objc open var highlightLineDashPhase = CGFloat(0.0)
|
||||
@objc open var highlightLineDashLengths: [CGFloat]?
|
||||
|
||||
/// Sets labels that should be drawn around the RadarChart at the end of each web line.
|
||||
@objc open var labels = [String]()
|
||||
|
||||
/// Sets the labels that should be drawn around the RadarChart at the end of each web line.
|
||||
open func setLabels(_ labels: String...)
|
||||
{
|
||||
self.labels = labels
|
||||
}
|
||||
|
||||
public override init()
|
||||
{
|
||||
super.init()
|
||||
}
|
||||
|
||||
public override init(dataSets: [IChartDataSet]?)
|
||||
{
|
||||
super.init(dataSets: dataSets)
|
||||
}
|
||||
|
||||
open override func entryForHighlight(_ highlight: Highlight) -> ChartDataEntry?
|
||||
{
|
||||
return getDataSetByIndex(highlight.dataSetIndex)?.entryForIndex(Int(highlight.x))
|
||||
}
|
||||
}
|
||||
51
Pods/Charts/Source/Charts/Data/Implementations/Standard/RadarChartDataEntry.swift
generated
Normal file
51
Pods/Charts/Source/Charts/Data/Implementations/Standard/RadarChartDataEntry.swift
generated
Normal file
@@ -0,0 +1,51 @@
|
||||
//
|
||||
// RadarChartDataEntry.swift
|
||||
// Charts
|
||||
//
|
||||
// Copyright 2015 Daniel Cohen Gindi & Philipp Jahoda
|
||||
// A port of MPAndroidChart for iOS
|
||||
// Licensed under Apache License 2.0
|
||||
//
|
||||
// https://github.com/danielgindi/Charts
|
||||
//
|
||||
|
||||
import Foundation
|
||||
import CoreGraphics
|
||||
|
||||
open class RadarChartDataEntry: ChartDataEntry
|
||||
{
|
||||
public required init()
|
||||
{
|
||||
super.init()
|
||||
}
|
||||
|
||||
/// - parameter value: The value on the y-axis.
|
||||
/// - parameter data: Spot for additional data this Entry represents.
|
||||
@objc public init(value: Double, data: AnyObject?)
|
||||
{
|
||||
super.init(x: 0.0, y: value, data: data)
|
||||
}
|
||||
|
||||
/// - parameter value: The value on the y-axis.
|
||||
@objc public convenience init(value: Double)
|
||||
{
|
||||
self.init(value: value, data: nil)
|
||||
}
|
||||
|
||||
// MARK: Data property accessors
|
||||
|
||||
@objc open var value: Double
|
||||
{
|
||||
get { return y }
|
||||
set { y = value }
|
||||
}
|
||||
|
||||
// MARK: NSCopying
|
||||
|
||||
open override func copyWithZone(_ zone: NSZone?) -> AnyObject
|
||||
{
|
||||
let copy = super.copyWithZone(zone) as! RadarChartDataEntry
|
||||
|
||||
return copy
|
||||
}
|
||||
}
|
||||
59
Pods/Charts/Source/Charts/Data/Implementations/Standard/RadarChartDataSet.swift
generated
Normal file
59
Pods/Charts/Source/Charts/Data/Implementations/Standard/RadarChartDataSet.swift
generated
Normal file
@@ -0,0 +1,59 @@
|
||||
//
|
||||
// RadarChartDataSet.swift
|
||||
// Charts
|
||||
//
|
||||
// Copyright 2015 Daniel Cohen Gindi & Philipp Jahoda
|
||||
// A port of MPAndroidChart for iOS
|
||||
// Licensed under Apache License 2.0
|
||||
//
|
||||
// https://github.com/danielgindi/Charts
|
||||
//
|
||||
|
||||
import Foundation
|
||||
import CoreGraphics
|
||||
|
||||
|
||||
open class RadarChartDataSet: LineRadarChartDataSet, IRadarChartDataSet
|
||||
{
|
||||
private func initialize()
|
||||
{
|
||||
self.valueFont = NSUIFont.systemFont(ofSize: 13.0)
|
||||
}
|
||||
|
||||
public required init()
|
||||
{
|
||||
super.init()
|
||||
initialize()
|
||||
}
|
||||
|
||||
public required override init(values: [ChartDataEntry]?, label: String?)
|
||||
{
|
||||
super.init(values: values, label: label)
|
||||
initialize()
|
||||
}
|
||||
|
||||
// MARK: - Data functions and accessors
|
||||
|
||||
// MARK: - Styling functions and accessors
|
||||
|
||||
/// flag indicating whether highlight circle should be drawn or not
|
||||
/// **default**: false
|
||||
open var drawHighlightCircleEnabled: Bool = false
|
||||
|
||||
/// - returns: `true` if highlight circle should be drawn, `false` ifnot
|
||||
open var isDrawHighlightCircleEnabled: Bool { return drawHighlightCircleEnabled }
|
||||
|
||||
open var highlightCircleFillColor: NSUIColor? = NSUIColor.white
|
||||
|
||||
/// The stroke color for highlight circle.
|
||||
/// If `nil`, the color of the dataset is taken.
|
||||
open var highlightCircleStrokeColor: NSUIColor?
|
||||
|
||||
open var highlightCircleStrokeAlpha: CGFloat = 0.3
|
||||
|
||||
open var highlightCircleInnerRadius: CGFloat = 3.0
|
||||
|
||||
open var highlightCircleOuterRadius: CGFloat = 4.0
|
||||
|
||||
open var highlightCircleStrokeWidth: CGFloat = 2.0
|
||||
}
|
||||
48
Pods/Charts/Source/Charts/Data/Implementations/Standard/ScatterChartData.swift
generated
Normal file
48
Pods/Charts/Source/Charts/Data/Implementations/Standard/ScatterChartData.swift
generated
Normal file
@@ -0,0 +1,48 @@
|
||||
//
|
||||
// ScatterChartData.swift
|
||||
// Charts
|
||||
//
|
||||
// Copyright 2015 Daniel Cohen Gindi & Philipp Jahoda
|
||||
// A port of MPAndroidChart for iOS
|
||||
// Licensed under Apache License 2.0
|
||||
//
|
||||
// https://github.com/danielgindi/Charts
|
||||
//
|
||||
|
||||
import Foundation
|
||||
import CoreGraphics
|
||||
|
||||
open class ScatterChartData: BarLineScatterCandleBubbleChartData
|
||||
{
|
||||
public override init()
|
||||
{
|
||||
super.init()
|
||||
}
|
||||
|
||||
public override init(dataSets: [IChartDataSet]?)
|
||||
{
|
||||
super.init(dataSets: dataSets)
|
||||
}
|
||||
|
||||
/// - returns: The maximum shape-size across all DataSets.
|
||||
@objc open func getGreatestShapeSize() -> CGFloat
|
||||
{
|
||||
var max = CGFloat(0.0)
|
||||
|
||||
for set in _dataSets
|
||||
{
|
||||
let scatterDataSet = set as? IScatterChartDataSet
|
||||
|
||||
if scatterDataSet == nil
|
||||
{
|
||||
print("ScatterChartData: Found a DataSet which is not a ScatterChartDataSet", terminator: "\n")
|
||||
}
|
||||
else if let size = scatterDataSet?.scatterShapeSize, size > max
|
||||
{
|
||||
max = size
|
||||
}
|
||||
}
|
||||
|
||||
return max
|
||||
}
|
||||
}
|
||||
78
Pods/Charts/Source/Charts/Data/Implementations/Standard/ScatterChartDataSet.swift
generated
Normal file
78
Pods/Charts/Source/Charts/Data/Implementations/Standard/ScatterChartDataSet.swift
generated
Normal file
@@ -0,0 +1,78 @@
|
||||
//
|
||||
// ScatterChartDataSet.swift
|
||||
// Charts
|
||||
//
|
||||
// Copyright 2015 Daniel Cohen Gindi & Philipp Jahoda
|
||||
// A port of MPAndroidChart for iOS
|
||||
// Licensed under Apache License 2.0
|
||||
//
|
||||
// https://github.com/danielgindi/Charts
|
||||
//
|
||||
|
||||
import Foundation
|
||||
import CoreGraphics
|
||||
|
||||
open class ScatterChartDataSet: LineScatterCandleRadarChartDataSet, IScatterChartDataSet
|
||||
{
|
||||
|
||||
@objc(ScatterShape)
|
||||
public enum Shape: Int
|
||||
{
|
||||
case square
|
||||
case circle
|
||||
case triangle
|
||||
case cross
|
||||
case x
|
||||
case chevronUp
|
||||
case chevronDown
|
||||
}
|
||||
|
||||
/// The size the scatter shape will have
|
||||
open var scatterShapeSize = CGFloat(10.0)
|
||||
|
||||
/// The radius of the hole in the shape (applies to Square, Circle and Triangle)
|
||||
/// **default**: 0.0
|
||||
open var scatterShapeHoleRadius: CGFloat = 0.0
|
||||
|
||||
/// Color for the hole in the shape. Setting to `nil` will behave as transparent.
|
||||
/// **default**: nil
|
||||
open var scatterShapeHoleColor: NSUIColor? = nil
|
||||
|
||||
/// Sets the ScatterShape this DataSet should be drawn with.
|
||||
/// This will search for an available IShapeRenderer and set this renderer for the DataSet
|
||||
@objc open func setScatterShape(_ shape: Shape)
|
||||
{
|
||||
self.shapeRenderer = ScatterChartDataSet.renderer(forShape: shape)
|
||||
}
|
||||
|
||||
/// The IShapeRenderer responsible for rendering this DataSet.
|
||||
/// This can also be used to set a custom IShapeRenderer aside from the default ones.
|
||||
/// **default**: `SquareShapeRenderer`
|
||||
open var shapeRenderer: IShapeRenderer? = SquareShapeRenderer()
|
||||
|
||||
@objc open class func renderer(forShape shape: Shape) -> IShapeRenderer
|
||||
{
|
||||
switch shape
|
||||
{
|
||||
case .square: return SquareShapeRenderer()
|
||||
case .circle: return CircleShapeRenderer()
|
||||
case .triangle: return TriangleShapeRenderer()
|
||||
case .cross: return CrossShapeRenderer()
|
||||
case .x: return XShapeRenderer()
|
||||
case .chevronUp: return ChevronUpShapeRenderer()
|
||||
case .chevronDown: return ChevronDownShapeRenderer()
|
||||
}
|
||||
}
|
||||
|
||||
// MARK: NSCopying
|
||||
|
||||
open override func copyWithZone(_ zone: NSZone?) -> AnyObject
|
||||
{
|
||||
let copy = super.copyWithZone(zone) as! ScatterChartDataSet
|
||||
copy.scatterShapeSize = scatterShapeSize
|
||||
copy.scatterShapeHoleRadius = scatterShapeHoleRadius
|
||||
copy.scatterShapeHoleColor = scatterShapeHoleColor
|
||||
copy.shapeRenderer = shapeRenderer
|
||||
return copy
|
||||
}
|
||||
}
|
||||
42
Pods/Charts/Source/Charts/Data/Interfaces/IBarChartDataSet.swift
generated
Normal file
42
Pods/Charts/Source/Charts/Data/Interfaces/IBarChartDataSet.swift
generated
Normal file
@@ -0,0 +1,42 @@
|
||||
//
|
||||
// IBarChartDataSet.swift
|
||||
// Charts
|
||||
//
|
||||
// Copyright 2015 Daniel Cohen Gindi & Philipp Jahoda
|
||||
// A port of MPAndroidChart for iOS
|
||||
// Licensed under Apache License 2.0
|
||||
//
|
||||
// https://github.com/danielgindi/Charts
|
||||
//
|
||||
|
||||
import Foundation
|
||||
import CoreGraphics
|
||||
|
||||
@objc
|
||||
public protocol IBarChartDataSet: IBarLineScatterCandleBubbleChartDataSet
|
||||
{
|
||||
// MARK: - Data functions and accessors
|
||||
|
||||
// MARK: - Styling functions and accessors
|
||||
|
||||
/// - returns: `true` if this DataSet is stacked (stacksize > 1) or not.
|
||||
var isStacked: Bool { get }
|
||||
|
||||
/// - returns: The maximum number of bars that can be stacked upon another in this DataSet.
|
||||
var stackSize: Int { get }
|
||||
|
||||
/// the color used for drawing the bar-shadows. The bar shadows is a surface behind the bar that indicates the maximum value
|
||||
var barShadowColor: NSUIColor { get set }
|
||||
|
||||
/// the width used for drawing borders around the bars. If borderWidth == 0, no border will be drawn.
|
||||
var barBorderWidth : CGFloat { get set }
|
||||
|
||||
/// the color drawing borders around the bars.
|
||||
var barBorderColor: NSUIColor { get set }
|
||||
|
||||
/// the alpha value (transparency) that is used for drawing the highlight indicator bar. min = 0.0 (fully transparent), max = 1.0 (fully opaque)
|
||||
var highlightAlpha: CGFloat { get set }
|
||||
|
||||
/// array of labels used to describe the different values of the stacked bars
|
||||
var stackLabels: [String] { get set }
|
||||
}
|
||||
26
Pods/Charts/Source/Charts/Data/Interfaces/IBarLineScatterCandleBubbleChartDataSet.swift
generated
Normal file
26
Pods/Charts/Source/Charts/Data/Interfaces/IBarLineScatterCandleBubbleChartDataSet.swift
generated
Normal file
@@ -0,0 +1,26 @@
|
||||
//
|
||||
// IBarLineScatterCandleBubbleChartDataSet.swift
|
||||
// Charts
|
||||
//
|
||||
// Copyright 2015 Daniel Cohen Gindi & Philipp Jahoda
|
||||
// A port of MPAndroidChart for iOS
|
||||
// Licensed under Apache License 2.0
|
||||
//
|
||||
// https://github.com/danielgindi/Charts
|
||||
//
|
||||
|
||||
import Foundation
|
||||
import CoreGraphics
|
||||
|
||||
@objc
|
||||
public protocol IBarLineScatterCandleBubbleChartDataSet: IChartDataSet
|
||||
{
|
||||
// MARK: - Data functions and accessors
|
||||
|
||||
// MARK: - Styling functions and accessors
|
||||
|
||||
var highlightColor: NSUIColor { get set }
|
||||
var highlightLineWidth: CGFloat { get set }
|
||||
var highlightLineDashPhase: CGFloat { get set }
|
||||
var highlightLineDashLengths: [CGFloat]? { get set }
|
||||
}
|
||||
27
Pods/Charts/Source/Charts/Data/Interfaces/IBubbleChartDataSet.swift
generated
Normal file
27
Pods/Charts/Source/Charts/Data/Interfaces/IBubbleChartDataSet.swift
generated
Normal file
@@ -0,0 +1,27 @@
|
||||
//
|
||||
// IBubbleChartDataSet.swift
|
||||
// Charts
|
||||
//
|
||||
// Copyright 2015 Daniel Cohen Gindi & Philipp Jahoda
|
||||
// A port of MPAndroidChart for iOS
|
||||
// Licensed under Apache License 2.0
|
||||
//
|
||||
// https://github.com/danielgindi/Charts
|
||||
//
|
||||
|
||||
import Foundation
|
||||
import CoreGraphics
|
||||
|
||||
@objc
|
||||
public protocol IBubbleChartDataSet: IBarLineScatterCandleBubbleChartDataSet
|
||||
{
|
||||
// MARK: - Data functions and accessors
|
||||
|
||||
var maxSize: CGFloat { get }
|
||||
var isNormalizeSizeEnabled: Bool { get }
|
||||
|
||||
// MARK: - Styling functions and accessors
|
||||
|
||||
/// Sets/gets the width of the circle that surrounds the bubble when highlighted
|
||||
var highlightCircleWidth: CGFloat { get set }
|
||||
}
|
||||
66
Pods/Charts/Source/Charts/Data/Interfaces/ICandleChartDataSet.swift
generated
Normal file
66
Pods/Charts/Source/Charts/Data/Interfaces/ICandleChartDataSet.swift
generated
Normal file
@@ -0,0 +1,66 @@
|
||||
//
|
||||
// ICandleChartDataSet.swift
|
||||
// Charts
|
||||
//
|
||||
// Copyright 2015 Daniel Cohen Gindi & Philipp Jahoda
|
||||
// A port of MPAndroidChart for iOS
|
||||
// Licensed under Apache License 2.0
|
||||
//
|
||||
// https://github.com/danielgindi/Charts
|
||||
//
|
||||
|
||||
import Foundation
|
||||
import CoreGraphics
|
||||
|
||||
@objc
|
||||
public protocol ICandleChartDataSet: ILineScatterCandleRadarChartDataSet
|
||||
{
|
||||
// MARK: - Data functions and accessors
|
||||
|
||||
// MARK: - Styling functions and accessors
|
||||
|
||||
/// the space that is left out on the left and right side of each candle,
|
||||
/// **default**: 0.1 (10%), max 0.45, min 0.0
|
||||
var barSpace: CGFloat { get set }
|
||||
|
||||
/// should the candle bars show?
|
||||
/// when false, only "ticks" will show
|
||||
///
|
||||
/// **default**: true
|
||||
var showCandleBar: Bool { get set }
|
||||
|
||||
/// the width of the candle-shadow-line in pixels.
|
||||
///
|
||||
/// **default**: 3.0
|
||||
var shadowWidth: CGFloat { get set }
|
||||
|
||||
/// the color of the shadow line
|
||||
var shadowColor: NSUIColor? { get set }
|
||||
|
||||
/// use candle color for the shadow
|
||||
var shadowColorSameAsCandle: Bool { get set }
|
||||
|
||||
/// Is the shadow color same as the candle color?
|
||||
var isShadowColorSameAsCandle: Bool { get }
|
||||
|
||||
/// color for open == close
|
||||
var neutralColor: NSUIColor? { get set }
|
||||
|
||||
/// color for open > close
|
||||
var increasingColor: NSUIColor? { get set }
|
||||
|
||||
/// color for open < close
|
||||
var decreasingColor: NSUIColor? { get set }
|
||||
|
||||
/// Are increasing values drawn as filled?
|
||||
var increasingFilled: Bool { get set }
|
||||
|
||||
/// Are increasing values drawn as filled?
|
||||
var isIncreasingFilled: Bool { get }
|
||||
|
||||
/// Are decreasing values drawn as filled?
|
||||
var decreasingFilled: Bool { get set }
|
||||
|
||||
/// Are decreasing values drawn as filled?
|
||||
var isDecreasingFilled: Bool { get }
|
||||
}
|
||||
261
Pods/Charts/Source/Charts/Data/Interfaces/IChartDataSet.swift
generated
Normal file
261
Pods/Charts/Source/Charts/Data/Interfaces/IChartDataSet.swift
generated
Normal file
@@ -0,0 +1,261 @@
|
||||
//
|
||||
// IChartDataSet.swift
|
||||
// Charts
|
||||
//
|
||||
// Copyright 2015 Daniel Cohen Gindi & Philipp Jahoda
|
||||
// A port of MPAndroidChart for iOS
|
||||
// Licensed under Apache License 2.0
|
||||
//
|
||||
// https://github.com/danielgindi/Charts
|
||||
//
|
||||
|
||||
import Foundation
|
||||
import CoreGraphics
|
||||
|
||||
@objc
|
||||
public protocol IChartDataSet
|
||||
{
|
||||
// MARK: - Data functions and accessors
|
||||
|
||||
/// Use this method to tell the data set that the underlying data has changed
|
||||
func notifyDataSetChanged()
|
||||
|
||||
/// Calculates the minimum and maximum x and y values (_xMin, _xMax, _yMin, _yMax).
|
||||
func calcMinMax()
|
||||
|
||||
/// Calculates the min and max y-values from the Entry closest to the given fromX to the Entry closest to the given toX value.
|
||||
/// This is only needed for the autoScaleMinMax feature.
|
||||
func calcMinMaxY(fromX: Double, toX: Double)
|
||||
|
||||
/// - returns: The minimum y-value this DataSet holds
|
||||
var yMin: Double { get }
|
||||
|
||||
/// - returns: The maximum y-value this DataSet holds
|
||||
var yMax: Double { get }
|
||||
|
||||
/// - returns: The minimum x-value this DataSet holds
|
||||
var xMin: Double { get }
|
||||
|
||||
/// - returns: The maximum x-value this DataSet holds
|
||||
var xMax: Double { get }
|
||||
|
||||
/// - returns: The number of y-values this DataSet represents
|
||||
var entryCount: Int { get }
|
||||
|
||||
/// - returns: The entry object found at the given index (not x-value!)
|
||||
/// - throws: out of bounds
|
||||
/// if `i` is out of bounds, it may throw an out-of-bounds exception
|
||||
func entryForIndex(_ i: Int) -> ChartDataEntry?
|
||||
|
||||
/// - returns: The first Entry object found at the given x-value with binary search.
|
||||
/// If the no Entry at the specified x-value is found, this method returns the Entry at the closest x-value according to the rounding.
|
||||
/// nil if no Entry object at that x-value.
|
||||
/// - parameter xValue: the x-value
|
||||
/// - parameter closestToY: If there are multiple y-values for the specified x-value,
|
||||
/// - parameter rounding: determine whether to round up/down/closest if there is no Entry matching the provided x-value
|
||||
func entryForXValue(
|
||||
_ xValue: Double,
|
||||
closestToY yValue: Double,
|
||||
rounding: ChartDataSetRounding) -> ChartDataEntry?
|
||||
|
||||
/// - returns: The first Entry object found at the given x-value with binary search.
|
||||
/// If the no Entry at the specified x-value is found, this method returns the Entry at the closest x-value.
|
||||
/// nil if no Entry object at that x-value.
|
||||
/// - parameter xValue: the x-value
|
||||
/// - parameter closestToY: If there are multiple y-values for the specified x-value,
|
||||
func entryForXValue(
|
||||
_ xValue: Double,
|
||||
closestToY yValue: Double) -> ChartDataEntry?
|
||||
|
||||
/// - returns: All Entry objects found at the given x-value with binary search.
|
||||
/// An empty array if no Entry object at that x-value.
|
||||
func entriesForXValue(_ xValue: Double) -> [ChartDataEntry]
|
||||
|
||||
/// - returns: The array-index of the specified entry.
|
||||
/// If the no Entry at the specified x-value is found, this method returns the index of the Entry at the closest x-value according to the rounding.
|
||||
///
|
||||
/// - parameter xValue: x-value of the entry to search for
|
||||
/// - parameter closestToY: If there are multiple y-values for the specified x-value,
|
||||
/// - parameter rounding: Rounding method if exact value was not found
|
||||
func entryIndex(
|
||||
x xValue: Double,
|
||||
closestToY yValue: Double,
|
||||
rounding: ChartDataSetRounding) -> Int
|
||||
|
||||
/// - returns: The array-index of the specified entry
|
||||
///
|
||||
/// - parameter e: the entry to search for
|
||||
func entryIndex(entry e: ChartDataEntry) -> Int
|
||||
|
||||
/// Adds an Entry to the DataSet dynamically.
|
||||
///
|
||||
/// *optional feature, can return `false` ifnot implemented*
|
||||
///
|
||||
/// Entries are added to the end of the list.
|
||||
/// - parameter e: the entry to add
|
||||
/// - returns: `true` if the entry was added successfully, `false` ifthis feature is not supported
|
||||
func addEntry(_ e: ChartDataEntry) -> Bool
|
||||
|
||||
/// Adds an Entry to the DataSet dynamically.
|
||||
/// Entries are added to their appropriate index in the values array respective to their x-position.
|
||||
/// This will also recalculate the current minimum and maximum values of the DataSet and the value-sum.
|
||||
///
|
||||
/// *optional feature, can return `false` ifnot implemented*
|
||||
///
|
||||
/// Entries are added to the end of the list.
|
||||
/// - parameter e: the entry to add
|
||||
/// - returns: `true` if the entry was added successfully, `false` ifthis feature is not supported
|
||||
func addEntryOrdered(_ e: ChartDataEntry) -> Bool
|
||||
|
||||
/// Removes an Entry from the DataSet dynamically.
|
||||
///
|
||||
/// *optional feature, can return `false` ifnot implemented*
|
||||
///
|
||||
/// - parameter entry: the entry to remove
|
||||
/// - returns: `true` if the entry was removed successfully, `false` ifthe entry does not exist or if this feature is not supported
|
||||
func removeEntry(_ entry: ChartDataEntry) -> Bool
|
||||
|
||||
/// Removes the Entry object at the given index in the values array from the DataSet.
|
||||
///
|
||||
/// *optional feature, can return `false` ifnot implemented*
|
||||
///
|
||||
/// - parameter index: the index of the entry to remove
|
||||
/// - returns: `true` if the entry was removed successfully, `false` ifthe entry does not exist or if this feature is not supported
|
||||
func removeEntry(index: Int) -> Bool
|
||||
|
||||
/// Removes the Entry object closest to the given x-value from the DataSet.
|
||||
///
|
||||
/// *optional feature, can return `false` ifnot implemented*
|
||||
///
|
||||
/// - parameter x: the x-value to remove
|
||||
/// - returns: `true` if the entry was removed successfully, `false` ifthe entry does not exist or if this feature is not supported
|
||||
func removeEntry(x: Double) -> Bool
|
||||
|
||||
/// Removes the first Entry (at index 0) of this DataSet from the entries array.
|
||||
///
|
||||
/// *optional feature, can return `false` ifnot implemented*
|
||||
///
|
||||
/// - returns: `true` if the entry was removed successfully, `false` ifthe entry does not exist or if this feature is not supported
|
||||
func removeFirst() -> Bool
|
||||
|
||||
/// Removes the last Entry (at index 0) of this DataSet from the entries array.
|
||||
///
|
||||
/// *optional feature, can return `false` ifnot implemented*
|
||||
///
|
||||
/// - returns: `true` if the entry was removed successfully, `false` ifthe entry does not exist or if this feature is not supported
|
||||
func removeLast() -> Bool
|
||||
|
||||
/// Checks if this DataSet contains the specified Entry.
|
||||
///
|
||||
/// - returns: `true` if contains the entry, `false` ifnot.
|
||||
func contains(_ e: ChartDataEntry) -> Bool
|
||||
|
||||
/// Removes all values from this DataSet and does all necessary recalculations.
|
||||
///
|
||||
/// *optional feature, could throw if not implemented*
|
||||
func clear()
|
||||
|
||||
// MARK: - Styling functions and accessors
|
||||
|
||||
/// The label string that describes the DataSet.
|
||||
var label: String? { get }
|
||||
|
||||
/// The axis this DataSet should be plotted against.
|
||||
var axisDependency: YAxis.AxisDependency { get }
|
||||
|
||||
/// List representing all colors that are used for drawing the actual values for this DataSet
|
||||
var valueColors: [NSUIColor] { get }
|
||||
|
||||
/// All the colors that are used for this DataSet.
|
||||
/// Colors are reused as soon as the number of Entries the DataSet represents is higher than the size of the colors array.
|
||||
var colors: [NSUIColor] { get }
|
||||
|
||||
/// - returns: The color at the given index of the DataSet's color array.
|
||||
/// This prevents out-of-bounds by performing a modulus on the color index, so colours will repeat themselves.
|
||||
func color(atIndex: Int) -> NSUIColor
|
||||
|
||||
func resetColors()
|
||||
|
||||
func addColor(_ color: NSUIColor)
|
||||
|
||||
func setColor(_ color: NSUIColor)
|
||||
|
||||
/// if true, value highlighting is enabled
|
||||
var highlightEnabled: Bool { get set }
|
||||
|
||||
/// - returns: `true` if value highlighting is enabled for this dataset
|
||||
var isHighlightEnabled: Bool { get }
|
||||
|
||||
/// Custom formatter that is used instead of the auto-formatter if set
|
||||
var valueFormatter: IValueFormatter? { get set }
|
||||
|
||||
/// - returns: `true` if the valueFormatter object of this DataSet is null.
|
||||
var needsFormatter: Bool { get }
|
||||
|
||||
/// Sets/get a single color for value text.
|
||||
/// Setting the color clears the colors array and adds a single color.
|
||||
/// Getting will return the first color in the array.
|
||||
var valueTextColor: NSUIColor { get set }
|
||||
|
||||
/// - returns: The color at the specified index that is used for drawing the values inside the chart. Uses modulus internally.
|
||||
func valueTextColorAt(_ index: Int) -> NSUIColor
|
||||
|
||||
/// the font for the value-text labels
|
||||
var valueFont: NSUIFont { get set }
|
||||
|
||||
/// The form to draw for this dataset in the legend.
|
||||
///
|
||||
/// Return `.Default` to use the default legend form.
|
||||
var form: Legend.Form { get }
|
||||
|
||||
/// The form size to draw for this dataset in the legend.
|
||||
///
|
||||
/// Return `NaN` to use the default legend form size.
|
||||
var formSize: CGFloat { get }
|
||||
|
||||
/// The line width for drawing the form of this dataset in the legend
|
||||
///
|
||||
/// Return `NaN` to use the default legend form line width.
|
||||
var formLineWidth: CGFloat { get }
|
||||
|
||||
/// Line dash configuration for legend shapes that consist of lines.
|
||||
///
|
||||
/// This is how much (in pixels) into the dash pattern are we starting from.
|
||||
var formLineDashPhase: CGFloat { get }
|
||||
|
||||
/// Line dash configuration for legend shapes that consist of lines.
|
||||
///
|
||||
/// This is the actual dash pattern.
|
||||
/// I.e. [2, 3] will paint [-- -- ]
|
||||
/// [1, 3, 4, 2] will paint [- ---- - ---- ]
|
||||
var formLineDashLengths: [CGFloat]? { get }
|
||||
|
||||
/// Set this to true to draw y-values on the chart.
|
||||
///
|
||||
/// - note: For bar and line charts: if `maxVisibleCount` is reached, no values will be drawn even if this is enabled.
|
||||
var drawValuesEnabled: Bool { get set }
|
||||
|
||||
/// - returns: `true` if y-value drawing is enabled, `false` ifnot
|
||||
var isDrawValuesEnabled: Bool { get }
|
||||
|
||||
/// Set this to true to draw y-icons on the chart
|
||||
///
|
||||
/// - note: For bar and line charts: if `maxVisibleCount` is reached, no icons will be drawn even if this is enabled.
|
||||
var drawIconsEnabled: Bool { get set }
|
||||
|
||||
/// Returns true if y-icon drawing is enabled, false if not
|
||||
var isDrawIconsEnabled: Bool { get }
|
||||
|
||||
/// Offset of icons drawn on the chart.
|
||||
///
|
||||
/// For all charts except Pie and Radar it will be ordinary (x offset, y offset).
|
||||
///
|
||||
/// For Pie and Radar chart it will be (y offset, distance from center offset); so if you want icon to be rendered under value, you should increase X component of CGPoint, and if you want icon to be rendered closet to center, you should decrease height component of CGPoint.
|
||||
var iconsOffset: CGPoint { get set }
|
||||
|
||||
/// Set the visibility of this DataSet. If not visible, the DataSet will not be drawn to the chart upon refreshing it.
|
||||
var visible: Bool { get set }
|
||||
|
||||
/// - returns: `true` if this DataSet is visible inside the chart, or `false` ifit is currently hidden.
|
||||
var isVisible: Bool { get }
|
||||
}
|
||||
80
Pods/Charts/Source/Charts/Data/Interfaces/ILineChartDataSet.swift
generated
Normal file
80
Pods/Charts/Source/Charts/Data/Interfaces/ILineChartDataSet.swift
generated
Normal file
@@ -0,0 +1,80 @@
|
||||
//
|
||||
// ILineChartDataSet.swift
|
||||
// Charts
|
||||
//
|
||||
// Copyright 2015 Daniel Cohen Gindi & Philipp Jahoda
|
||||
// A port of MPAndroidChart for iOS
|
||||
// Licensed under Apache License 2.0
|
||||
//
|
||||
// https://github.com/danielgindi/Charts
|
||||
//
|
||||
|
||||
import Foundation
|
||||
import CoreGraphics
|
||||
|
||||
|
||||
@objc
|
||||
public protocol ILineChartDataSet: ILineRadarChartDataSet
|
||||
{
|
||||
// MARK: - Data functions and accessors
|
||||
|
||||
// MARK: - Styling functions and accessors
|
||||
|
||||
/// The drawing mode for this line dataset
|
||||
///
|
||||
/// **default**: Linear
|
||||
var mode: LineChartDataSet.Mode { get set }
|
||||
|
||||
/// Intensity for cubic lines (min = 0.05, max = 1)
|
||||
///
|
||||
/// **default**: 0.2
|
||||
var cubicIntensity: CGFloat { get set }
|
||||
|
||||
/// The radius of the drawn circles.
|
||||
var circleRadius: CGFloat { get set }
|
||||
|
||||
/// The hole radius of the drawn circles.
|
||||
var circleHoleRadius: CGFloat { get set }
|
||||
|
||||
var circleColors: [NSUIColor] { get set }
|
||||
|
||||
/// - returns: The color at the given index of the DataSet's circle-color array.
|
||||
/// Performs a IndexOutOfBounds check by modulus.
|
||||
func getCircleColor(atIndex: Int) -> NSUIColor?
|
||||
|
||||
/// Sets the one and ONLY color that should be used for this DataSet.
|
||||
/// Internally, this recreates the colors array and adds the specified color.
|
||||
func setCircleColor(_ color: NSUIColor)
|
||||
|
||||
/// Resets the circle-colors array and creates a new one
|
||||
func resetCircleColors(_ index: Int)
|
||||
|
||||
/// If true, drawing circles is enabled
|
||||
var drawCirclesEnabled: Bool { get set }
|
||||
|
||||
/// - returns: `true` if drawing circles for this DataSet is enabled, `false` ifnot
|
||||
var isDrawCirclesEnabled: Bool { get }
|
||||
|
||||
/// The color of the inner circle (the circle-hole).
|
||||
var circleHoleColor: NSUIColor? { get set }
|
||||
|
||||
/// `true` if drawing circles for this DataSet is enabled, `false` ifnot
|
||||
var drawCircleHoleEnabled: Bool { get set }
|
||||
|
||||
/// - returns: `true` if drawing the circle-holes is enabled, `false` ifnot.
|
||||
var isDrawCircleHoleEnabled: Bool { get }
|
||||
|
||||
/// This is how much (in pixels) into the dash pattern are we starting from.
|
||||
var lineDashPhase: CGFloat { get }
|
||||
|
||||
/// This is the actual dash pattern.
|
||||
/// I.e. [2, 3] will paint [-- -- ]
|
||||
/// [1, 3, 4, 2] will paint [- ---- - ---- ]
|
||||
var lineDashLengths: [CGFloat]? { get set }
|
||||
|
||||
/// Line cap type, default is CGLineCap.Butt
|
||||
var lineCapType: CGLineCap { get set }
|
||||
|
||||
/// Sets a custom IFillFormatter to the chart that handles the position of the filled-line for each DataSet. Set this to null to use the default logic.
|
||||
var fillFormatter: IFillFormatter? { get set }
|
||||
}
|
||||
45
Pods/Charts/Source/Charts/Data/Interfaces/ILineRadarChartDataSet.swift
generated
Normal file
45
Pods/Charts/Source/Charts/Data/Interfaces/ILineRadarChartDataSet.swift
generated
Normal file
@@ -0,0 +1,45 @@
|
||||
//
|
||||
// ILineRadarChartDataSet.swift
|
||||
// Charts
|
||||
//
|
||||
// Copyright 2015 Daniel Cohen Gindi & Philipp Jahoda
|
||||
// A port of MPAndroidChart for iOS
|
||||
// Licensed under Apache License 2.0
|
||||
//
|
||||
// https://github.com/danielgindi/Charts
|
||||
//
|
||||
|
||||
import Foundation
|
||||
import CoreGraphics
|
||||
|
||||
@objc
|
||||
public protocol ILineRadarChartDataSet: ILineScatterCandleRadarChartDataSet
|
||||
{
|
||||
// MARK: - Data functions and accessors
|
||||
|
||||
// MARK: - Styling functions and accessors
|
||||
|
||||
/// The color that is used for filling the line surface area.
|
||||
var fillColor: NSUIColor { get set }
|
||||
|
||||
/// - returns: The object that is used for filling the area below the line.
|
||||
/// **default**: nil
|
||||
var fill: Fill? { get set }
|
||||
|
||||
/// The alpha value that is used for filling the line surface.
|
||||
/// **default**: 0.33
|
||||
var fillAlpha: CGFloat { get set }
|
||||
|
||||
/// line width of the chart (min = 0.0, max = 10)
|
||||
///
|
||||
/// **default**: 1
|
||||
var lineWidth: CGFloat { get set }
|
||||
|
||||
/// Set to `true` if the DataSet should be drawn filled (surface), and not just as a line.
|
||||
/// Disabling this will give great performance boost.
|
||||
/// Please note that this method uses the path clipping for drawing the filled area (with images, gradients and layers).
|
||||
var drawFilledEnabled: Bool { get set }
|
||||
|
||||
/// - returns: `true` if filled drawing is enabled, `false` if not
|
||||
var isDrawFilledEnabled: Bool { get }
|
||||
}
|
||||
36
Pods/Charts/Source/Charts/Data/Interfaces/ILineScatterCandleRadarChartDataSet.swift
generated
Normal file
36
Pods/Charts/Source/Charts/Data/Interfaces/ILineScatterCandleRadarChartDataSet.swift
generated
Normal file
@@ -0,0 +1,36 @@
|
||||
//
|
||||
// ILineScatterCandleRadarChartDataSet.swift
|
||||
// Charts
|
||||
//
|
||||
// Copyright 2015 Daniel Cohen Gindi & Philipp Jahoda
|
||||
// A port of MPAndroidChart for iOS
|
||||
// Licensed under Apache License 2.0
|
||||
//
|
||||
// https://github.com/danielgindi/Charts
|
||||
//
|
||||
|
||||
import Foundation
|
||||
|
||||
@objc
|
||||
public protocol ILineScatterCandleRadarChartDataSet: IBarLineScatterCandleBubbleChartDataSet
|
||||
{
|
||||
// MARK: - Data functions and accessors
|
||||
|
||||
// MARK: - Styling functions and accessors
|
||||
|
||||
/// Enables / disables the horizontal highlight-indicator. If disabled, the indicator is not drawn.
|
||||
var drawHorizontalHighlightIndicatorEnabled: Bool { get set }
|
||||
|
||||
/// Enables / disables the vertical highlight-indicator. If disabled, the indicator is not drawn.
|
||||
var drawVerticalHighlightIndicatorEnabled: Bool { get set }
|
||||
|
||||
/// - returns: `true` if horizontal highlight indicator lines are enabled (drawn)
|
||||
var isHorizontalHighlightIndicatorEnabled: Bool { get }
|
||||
|
||||
/// - returns: `true` if vertical highlight indicator lines are enabled (drawn)
|
||||
var isVerticalHighlightIndicatorEnabled: Bool { get }
|
||||
|
||||
/// Enables / disables both vertical and horizontal highlight-indicators.
|
||||
/// :param: enabled
|
||||
func setDrawHighlightIndicators(_ enabled: Bool)
|
||||
}
|
||||
64
Pods/Charts/Source/Charts/Data/Interfaces/IPieChartDataSet.swift
generated
Normal file
64
Pods/Charts/Source/Charts/Data/Interfaces/IPieChartDataSet.swift
generated
Normal file
@@ -0,0 +1,64 @@
|
||||
//
|
||||
// IPieChartDataSet.swift
|
||||
// Charts
|
||||
//
|
||||
// Copyright 2015 Daniel Cohen Gindi & Philipp Jahoda
|
||||
// A port of MPAndroidChart for iOS
|
||||
// Licensed under Apache License 2.0
|
||||
//
|
||||
// https://github.com/danielgindi/Charts
|
||||
//
|
||||
|
||||
import Foundation
|
||||
import CoreGraphics
|
||||
|
||||
#if !os(OSX)
|
||||
import UIKit
|
||||
#endif
|
||||
|
||||
@objc
|
||||
public protocol IPieChartDataSet: IChartDataSet
|
||||
{
|
||||
// MARK: - Styling functions and accessors
|
||||
|
||||
/// the space in pixels between the pie-slices
|
||||
/// **default**: 0
|
||||
/// **maximum**: 20
|
||||
var sliceSpace: CGFloat { get set }
|
||||
|
||||
/// When enabled, slice spacing will be 0.0 when the smallest value is going to be smaller than the slice spacing itself.
|
||||
var automaticallyDisableSliceSpacing: Bool { get set }
|
||||
|
||||
/// indicates the selection distance of a pie slice
|
||||
var selectionShift: CGFloat { get set }
|
||||
|
||||
var xValuePosition: PieChartDataSet.ValuePosition { get set }
|
||||
var yValuePosition: PieChartDataSet.ValuePosition { get set }
|
||||
|
||||
/// When valuePosition is OutsideSlice, indicates line color
|
||||
var valueLineColor: NSUIColor? { get set }
|
||||
|
||||
/// When valuePosition is OutsideSlice, indicates line width
|
||||
var valueLineWidth: CGFloat { get set }
|
||||
|
||||
/// When valuePosition is OutsideSlice, indicates offset as percentage out of the slice size
|
||||
var valueLinePart1OffsetPercentage: CGFloat { get set }
|
||||
|
||||
/// When valuePosition is OutsideSlice, indicates length of first half of the line
|
||||
var valueLinePart1Length: CGFloat { get set }
|
||||
|
||||
/// When valuePosition is OutsideSlice, indicates length of second half of the line
|
||||
var valueLinePart2Length: CGFloat { get set }
|
||||
|
||||
/// When valuePosition is OutsideSlice, this allows variable line length
|
||||
var valueLineVariableLength: Bool { get set }
|
||||
|
||||
/// the font for the slice-text labels
|
||||
var entryLabelFont: NSUIFont? { get set }
|
||||
|
||||
/// the color for the slice-text labels
|
||||
var entryLabelColor: NSUIColor? { get set }
|
||||
|
||||
/// get/sets the color for the highlighted sector
|
||||
var highlightColor: NSUIColor? { get set }
|
||||
}
|
||||
40
Pods/Charts/Source/Charts/Data/Interfaces/IRadarChartDataSet.swift
generated
Normal file
40
Pods/Charts/Source/Charts/Data/Interfaces/IRadarChartDataSet.swift
generated
Normal file
@@ -0,0 +1,40 @@
|
||||
//
|
||||
// IRadarChartDataSet.swift
|
||||
// Charts
|
||||
//
|
||||
// Copyright 2015 Daniel Cohen Gindi & Philipp Jahoda
|
||||
// A port of MPAndroidChart for iOS
|
||||
// Licensed under Apache License 2.0
|
||||
//
|
||||
// https://github.com/danielgindi/Charts
|
||||
//
|
||||
|
||||
import Foundation
|
||||
import CoreGraphics
|
||||
|
||||
@objc
|
||||
public protocol IRadarChartDataSet: ILineRadarChartDataSet
|
||||
{
|
||||
// MARK: - Data functions and accessors
|
||||
|
||||
// MARK: - Styling functions and accessors
|
||||
|
||||
/// flag indicating whether highlight circle should be drawn or not
|
||||
var drawHighlightCircleEnabled: Bool { get set }
|
||||
|
||||
var isDrawHighlightCircleEnabled: Bool { get }
|
||||
|
||||
var highlightCircleFillColor: NSUIColor? { get set }
|
||||
|
||||
/// The stroke color for highlight circle.
|
||||
/// If `nil`, the color of the dataset is taken.
|
||||
var highlightCircleStrokeColor: NSUIColor? { get set }
|
||||
|
||||
var highlightCircleStrokeAlpha: CGFloat { get set }
|
||||
|
||||
var highlightCircleInnerRadius: CGFloat { get set }
|
||||
|
||||
var highlightCircleOuterRadius: CGFloat { get set }
|
||||
|
||||
var highlightCircleStrokeWidth: CGFloat { get set }
|
||||
}
|
||||
36
Pods/Charts/Source/Charts/Data/Interfaces/IScatterChartDataSet.swift
generated
Normal file
36
Pods/Charts/Source/Charts/Data/Interfaces/IScatterChartDataSet.swift
generated
Normal file
@@ -0,0 +1,36 @@
|
||||
//
|
||||
// IScatterChartDataSet.swift
|
||||
// Charts
|
||||
//
|
||||
// Copyright 2015 Daniel Cohen Gindi & Philipp Jahoda
|
||||
// A port of MPAndroidChart for iOS
|
||||
// Licensed under Apache License 2.0
|
||||
//
|
||||
// https://github.com/danielgindi/Charts
|
||||
//
|
||||
|
||||
import Foundation
|
||||
import CoreGraphics
|
||||
|
||||
@objc
|
||||
public protocol IScatterChartDataSet: ILineScatterCandleRadarChartDataSet
|
||||
{
|
||||
// MARK: - Data functions and accessors
|
||||
|
||||
// MARK: - Styling functions and accessors
|
||||
|
||||
/// - returns: The size the scatter shape will have
|
||||
var scatterShapeSize: CGFloat { get }
|
||||
|
||||
/// - returns: The radius of the hole in the shape (applies to Square, Circle and Triangle)
|
||||
/// Set this to <= 0 to remove holes.
|
||||
/// **default**: 0.0
|
||||
var scatterShapeHoleRadius: CGFloat { get }
|
||||
|
||||
/// - returns: Color for the hole in the shape. Setting to `nil` will behave as transparent.
|
||||
/// **default**: nil
|
||||
var scatterShapeHoleColor: NSUIColor? { get }
|
||||
|
||||
/// - returns: The IShapeRenderer responsible for rendering this DataSet.
|
||||
var shapeRenderer: IShapeRenderer? { get }
|
||||
}
|
||||
152
Pods/Charts/Source/Charts/Filters/DataApproximator+N.swift
generated
Normal file
152
Pods/Charts/Source/Charts/Filters/DataApproximator+N.swift
generated
Normal file
@@ -0,0 +1,152 @@
|
||||
//
|
||||
// DataApproximator+N.swift
|
||||
// Charts
|
||||
//
|
||||
// Created by M Ivaniushchenko on 9/6/17.
|
||||
// Licensed under Apache License 2.0
|
||||
//
|
||||
// https://github.com/danielgindi/Charts
|
||||
//
|
||||
|
||||
import Foundation
|
||||
|
||||
extension CGPoint {
|
||||
fileprivate func distanceToLine(from linePoint1: CGPoint, to linePoint2: CGPoint) -> CGFloat {
|
||||
let dx = linePoint2.x - linePoint1.x
|
||||
let dy = linePoint2.y - linePoint1.y
|
||||
|
||||
let dividend = fabs(dy * self.x - dx * self.y - linePoint1.x * linePoint2.y + linePoint2.x * linePoint1.y)
|
||||
let divisor = sqrt(dx * dx + dy * dy)
|
||||
|
||||
return dividend / divisor
|
||||
}
|
||||
}
|
||||
|
||||
private struct LineAlt {
|
||||
let start: Int
|
||||
let end: Int
|
||||
|
||||
var distance: CGFloat = 0
|
||||
var index: Int = 0
|
||||
|
||||
init(start: Int, end: Int, points: [CGPoint]) {
|
||||
self.start = start
|
||||
self.end = end
|
||||
|
||||
let startPoint = points[start]
|
||||
let endPoint = points[end]
|
||||
|
||||
guard (end > start + 1) else {
|
||||
return
|
||||
}
|
||||
|
||||
for i in start + 1 ..< end {
|
||||
let currentPoint = points[i]
|
||||
|
||||
let distance = currentPoint.distanceToLine(from: startPoint, to: endPoint)
|
||||
|
||||
if distance > self.distance {
|
||||
self.index = i
|
||||
self.distance = distance
|
||||
}
|
||||
}
|
||||
}
|
||||
}
|
||||
|
||||
extension LineAlt: Comparable {
|
||||
static func ==(lhs: LineAlt, rhs: LineAlt) -> Bool {
|
||||
return (lhs.start == rhs.start) && (lhs.end == rhs.end) && (lhs.index == rhs.index)
|
||||
}
|
||||
|
||||
static func <(lhs: LineAlt, rhs: LineAlt) -> Bool {
|
||||
return lhs.distance < rhs.distance
|
||||
}
|
||||
}
|
||||
|
||||
|
||||
extension DataApproximator {
|
||||
/// uses the douglas peuker algorithm to reduce the given arraylist of entries to given number of points
|
||||
/// More algorithm details here - http://psimpl.sourceforge.net/douglas-peucker.html
|
||||
@objc open class func reduceWithDouglasPeukerN(_ points: [CGPoint], resultCount: Int) -> [CGPoint]
|
||||
{
|
||||
// if a shape has 2 or less points it cannot be reduced
|
||||
if resultCount <= 2 || resultCount >= points.count
|
||||
{
|
||||
return points
|
||||
}
|
||||
var keep = [Bool](repeating: false, count: points.count)
|
||||
|
||||
// first and last always stay
|
||||
keep[0] = true
|
||||
keep[points.count - 1] = true
|
||||
var currentStoredPoints = 2
|
||||
|
||||
var queue = [LineAlt]()
|
||||
let line = LineAlt(start: 0, end: points.count - 1, points: points)
|
||||
queue.append(line)
|
||||
|
||||
repeat {
|
||||
let line = queue.popLast()!
|
||||
|
||||
// store the key
|
||||
keep[line.index] = true
|
||||
|
||||
// check point count tolerance
|
||||
currentStoredPoints += 1
|
||||
|
||||
if (currentStoredPoints == resultCount) {
|
||||
break;
|
||||
}
|
||||
|
||||
// split the polyline at the key and recurse
|
||||
let left = LineAlt(start: line.start, end: line.index, points: points)
|
||||
if (left.index > 0) {
|
||||
self.insertLine(left, into: &queue)
|
||||
}
|
||||
|
||||
let right = LineAlt(start: line.index, end: line.end, points: points)
|
||||
if (right.index > 0) {
|
||||
self.insertLine(right, into: &queue)
|
||||
}
|
||||
|
||||
} while !queue.isEmpty
|
||||
|
||||
// create a new array with series, only take the kept ones
|
||||
let reducedEntries = points.enumerated().compactMap { (index: Int, point: CGPoint) -> CGPoint? in
|
||||
return keep[index] ? point : nil
|
||||
}
|
||||
|
||||
return reducedEntries
|
||||
}
|
||||
|
||||
// Keeps array sorted
|
||||
private static func insertLine(_ line: LineAlt, into array: inout [LineAlt]) {
|
||||
let insertionIndex = self.insertionIndex(for: line, into: &array)
|
||||
array.insert(line, at: insertionIndex)
|
||||
}
|
||||
|
||||
private static func insertionIndex(for line: LineAlt, into array: inout [LineAlt]) -> Int {
|
||||
var indices = array.indices
|
||||
|
||||
while !indices.isEmpty {
|
||||
let midIndex = indices.lowerBound.advanced(by: indices.count / 2)
|
||||
let midLine = array[midIndex]
|
||||
|
||||
if midLine == line {
|
||||
return midIndex
|
||||
}
|
||||
else if (line < midLine) {
|
||||
// perform search in left half
|
||||
indices = indices.lowerBound..<midIndex
|
||||
}
|
||||
else {
|
||||
// perform search in right half
|
||||
indices = (midIndex + 1)..<indices.upperBound
|
||||
}
|
||||
}
|
||||
|
||||
return indices.lowerBound
|
||||
}
|
||||
}
|
||||
|
||||
|
||||
123
Pods/Charts/Source/Charts/Filters/DataApproximator.swift
generated
Normal file
123
Pods/Charts/Source/Charts/Filters/DataApproximator.swift
generated
Normal file
@@ -0,0 +1,123 @@
|
||||
//
|
||||
// DataApproximator.swift
|
||||
// Charts
|
||||
//
|
||||
// Copyright 2015 Daniel Cohen Gindi & Philipp Jahoda
|
||||
// A port of MPAndroidChart for iOS
|
||||
// Licensed under Apache License 2.0
|
||||
//
|
||||
// https://github.com/danielgindi/Charts
|
||||
//
|
||||
|
||||
import Foundation
|
||||
import CoreGraphics
|
||||
|
||||
@objc(ChartDataApproximator)
|
||||
open class DataApproximator: NSObject
|
||||
{
|
||||
/// uses the douglas peuker algorithm to reduce the given arraylist of entries
|
||||
@objc open class func reduceWithDouglasPeuker(_ points: [CGPoint], tolerance: CGFloat) -> [CGPoint]
|
||||
{
|
||||
// if a shape has 2 or less points it cannot be reduced
|
||||
if tolerance <= 0 || points.count < 3
|
||||
{
|
||||
return points
|
||||
}
|
||||
|
||||
var keep = [Bool](repeating: false, count: points.count)
|
||||
|
||||
// first and last always stay
|
||||
keep[0] = true
|
||||
keep[points.count - 1] = true
|
||||
|
||||
// first and last entry are entry point to recursion
|
||||
reduceWithDouglasPeuker(points: points,
|
||||
tolerance: tolerance,
|
||||
start: 0,
|
||||
end: points.count - 1,
|
||||
keep: &keep)
|
||||
|
||||
// create a new array with series, only take the kept ones
|
||||
var reducedEntries = [CGPoint]()
|
||||
for i in 0 ..< points.count
|
||||
{
|
||||
if keep[i]
|
||||
{
|
||||
reducedEntries.append(points[i])
|
||||
}
|
||||
}
|
||||
|
||||
return reducedEntries
|
||||
}
|
||||
|
||||
/// apply the Douglas-Peucker-Reduction to an array of `CGPoint`s with a given tolerance
|
||||
///
|
||||
/// - parameter points:
|
||||
/// - parameter tolerance:
|
||||
/// - parameter start:
|
||||
/// - parameter end:
|
||||
open class func reduceWithDouglasPeuker(
|
||||
points: [CGPoint],
|
||||
tolerance: CGFloat,
|
||||
start: Int,
|
||||
end: Int,
|
||||
keep: inout [Bool])
|
||||
{
|
||||
if end <= start + 1
|
||||
{
|
||||
// recursion finished
|
||||
return
|
||||
}
|
||||
|
||||
var greatestIndex = Int(0)
|
||||
var greatestDistance = CGFloat(0.0)
|
||||
|
||||
let line = Line(pt1: points[start], pt2: points[end])
|
||||
|
||||
for i in start + 1 ..< end
|
||||
{
|
||||
let distance = line.distance(toPoint: points[i])
|
||||
|
||||
if distance > greatestDistance
|
||||
{
|
||||
greatestDistance = distance
|
||||
greatestIndex = i
|
||||
}
|
||||
}
|
||||
|
||||
if greatestDistance > tolerance
|
||||
{
|
||||
// keep max dist point
|
||||
keep[greatestIndex] = true
|
||||
|
||||
// recursive call
|
||||
reduceWithDouglasPeuker(points: points, tolerance: tolerance, start: start, end: greatestIndex, keep: &keep)
|
||||
reduceWithDouglasPeuker(points: points, tolerance: tolerance, start: greatestIndex, end: end, keep: &keep)
|
||||
} // else don't keep the point...
|
||||
}
|
||||
|
||||
private class Line
|
||||
{
|
||||
var sxey: CGFloat
|
||||
var exsy: CGFloat
|
||||
|
||||
var dx: CGFloat
|
||||
var dy: CGFloat
|
||||
|
||||
var length: CGFloat
|
||||
|
||||
init(pt1: CGPoint, pt2: CGPoint)
|
||||
{
|
||||
dx = pt1.x - pt2.x
|
||||
dy = pt1.y - pt2.y
|
||||
sxey = pt1.x * pt2.y
|
||||
exsy = pt2.x * pt1.y
|
||||
length = sqrt(dx * dx + dy * dy)
|
||||
}
|
||||
|
||||
func distance(toPoint pt: CGPoint) -> CGFloat
|
||||
{
|
||||
return abs(dy * pt.x - dx * pt.y + sxey - exsy) / length
|
||||
}
|
||||
}
|
||||
}
|
||||
100
Pods/Charts/Source/Charts/Formatters/DefaultAxisValueFormatter.swift
generated
Normal file
100
Pods/Charts/Source/Charts/Formatters/DefaultAxisValueFormatter.swift
generated
Normal file
@@ -0,0 +1,100 @@
|
||||
//
|
||||
// DefaultAxisValueFormatter.swift
|
||||
// Charts
|
||||
//
|
||||
// Copyright 2015 Daniel Cohen Gindi & Philipp Jahoda
|
||||
// A port of MPAndroidChart for iOS
|
||||
// Licensed under Apache License 2.0
|
||||
//
|
||||
// https://github.com/danielgindi/Charts
|
||||
//
|
||||
|
||||
import Foundation
|
||||
|
||||
@objc(ChartDefaultAxisValueFormatter)
|
||||
open class DefaultAxisValueFormatter: NSObject, IAxisValueFormatter
|
||||
{
|
||||
public typealias Block = (
|
||||
_ value: Double,
|
||||
_ axis: AxisBase?) -> String
|
||||
|
||||
@objc open var block: Block?
|
||||
|
||||
@objc open var hasAutoDecimals: Bool = false
|
||||
|
||||
private var _formatter: NumberFormatter?
|
||||
@objc open var formatter: NumberFormatter?
|
||||
{
|
||||
get { return _formatter }
|
||||
set
|
||||
{
|
||||
hasAutoDecimals = false
|
||||
_formatter = newValue
|
||||
}
|
||||
}
|
||||
|
||||
// TODO: Documentation. Especially the nil case
|
||||
private var _decimals: Int?
|
||||
open var decimals: Int?
|
||||
{
|
||||
get { return _decimals }
|
||||
set
|
||||
{
|
||||
_decimals = newValue
|
||||
|
||||
if let digits = newValue
|
||||
{
|
||||
self.formatter?.minimumFractionDigits = digits
|
||||
self.formatter?.maximumFractionDigits = digits
|
||||
self.formatter?.usesGroupingSeparator = true
|
||||
}
|
||||
}
|
||||
}
|
||||
|
||||
public override init()
|
||||
{
|
||||
super.init()
|
||||
|
||||
self.formatter = NumberFormatter()
|
||||
hasAutoDecimals = true
|
||||
}
|
||||
|
||||
@objc public init(formatter: NumberFormatter)
|
||||
{
|
||||
super.init()
|
||||
|
||||
self.formatter = formatter
|
||||
}
|
||||
|
||||
@objc public init(decimals: Int)
|
||||
{
|
||||
super.init()
|
||||
|
||||
self.formatter = NumberFormatter()
|
||||
self.formatter?.usesGroupingSeparator = true
|
||||
self.decimals = decimals
|
||||
hasAutoDecimals = true
|
||||
}
|
||||
|
||||
@objc public init(block: @escaping Block)
|
||||
{
|
||||
super.init()
|
||||
|
||||
self.block = block
|
||||
}
|
||||
|
||||
@objc public static func with(block: @escaping Block) -> DefaultAxisValueFormatter?
|
||||
{
|
||||
return DefaultAxisValueFormatter(block: block)
|
||||
}
|
||||
|
||||
open func stringForValue(_ value: Double,
|
||||
axis: AxisBase?) -> String
|
||||
{
|
||||
if let block = block {
|
||||
return block(value, axis)
|
||||
} else {
|
||||
return formatter?.string(from: NSNumber(floatLiteral: value)) ?? ""
|
||||
}
|
||||
}
|
||||
}
|
||||
62
Pods/Charts/Source/Charts/Formatters/DefaultFillFormatter.swift
generated
Normal file
62
Pods/Charts/Source/Charts/Formatters/DefaultFillFormatter.swift
generated
Normal file
@@ -0,0 +1,62 @@
|
||||
//
|
||||
// DefaultFillFormatter.swift
|
||||
// Charts
|
||||
//
|
||||
// Copyright 2015 Daniel Cohen Gindi & Philipp Jahoda
|
||||
// A port of MPAndroidChart for iOS
|
||||
// Licensed under Apache License 2.0
|
||||
//
|
||||
// https://github.com/danielgindi/Charts
|
||||
//
|
||||
|
||||
import Foundation
|
||||
import CoreGraphics
|
||||
|
||||
#if !os(OSX)
|
||||
import UIKit
|
||||
#endif
|
||||
|
||||
/// Default formatter that calculates the position of the filled line.
|
||||
@objc(ChartDefaultFillFormatter)
|
||||
open class DefaultFillFormatter: NSObject, IFillFormatter
|
||||
{
|
||||
public typealias Block = (
|
||||
_ dataSet: ILineChartDataSet,
|
||||
_ dataProvider: LineChartDataProvider) -> CGFloat
|
||||
|
||||
@objc open var block: Block?
|
||||
|
||||
public override init() { }
|
||||
|
||||
@objc public init(block: @escaping Block)
|
||||
{
|
||||
self.block = block
|
||||
}
|
||||
|
||||
@objc public static func with(block: @escaping Block) -> DefaultFillFormatter?
|
||||
{
|
||||
return DefaultFillFormatter(block: block)
|
||||
}
|
||||
|
||||
open func getFillLinePosition(
|
||||
dataSet: ILineChartDataSet,
|
||||
dataProvider: LineChartDataProvider) -> CGFloat
|
||||
{
|
||||
guard block == nil else { return block!(dataSet, dataProvider) }
|
||||
var fillMin: CGFloat = 0.0
|
||||
|
||||
if dataSet.yMax > 0.0 && dataSet.yMin < 0.0
|
||||
{
|
||||
fillMin = 0.0
|
||||
}
|
||||
else if let data = dataProvider.data
|
||||
{
|
||||
let max = data.yMax > 0.0 ? 0.0 : dataProvider.chartYMax
|
||||
let min = data.yMin < 0.0 ? 0.0 : dataProvider.chartYMin
|
||||
|
||||
fillMin = CGFloat(dataSet.yMin >= 0.0 ? min : max)
|
||||
}
|
||||
|
||||
return fillMin
|
||||
}
|
||||
}
|
||||
103
Pods/Charts/Source/Charts/Formatters/DefaultValueFormatter.swift
generated
Normal file
103
Pods/Charts/Source/Charts/Formatters/DefaultValueFormatter.swift
generated
Normal file
@@ -0,0 +1,103 @@
|
||||
//
|
||||
// DefaultValueFormatter.swift
|
||||
// Charts
|
||||
//
|
||||
// Copyright 2015 Daniel Cohen Gindi & Philipp Jahoda
|
||||
// A port of MPAndroidChart for iOS
|
||||
// Licensed under Apache License 2.0
|
||||
//
|
||||
// https://github.com/danielgindi/Charts
|
||||
//
|
||||
|
||||
import Foundation
|
||||
|
||||
@objc(ChartDefaultValueFormatter)
|
||||
open class DefaultValueFormatter: NSObject, IValueFormatter
|
||||
{
|
||||
public typealias Block = (
|
||||
_ value: Double,
|
||||
_ entry: ChartDataEntry,
|
||||
_ dataSetIndex: Int,
|
||||
_ viewPortHandler: ViewPortHandler?) -> String
|
||||
|
||||
@objc open var block: Block?
|
||||
|
||||
@objc open var hasAutoDecimals: Bool = false
|
||||
|
||||
private var _formatter: NumberFormatter?
|
||||
@objc open var formatter: NumberFormatter?
|
||||
{
|
||||
get { return _formatter }
|
||||
set
|
||||
{
|
||||
hasAutoDecimals = false
|
||||
_formatter = newValue
|
||||
}
|
||||
}
|
||||
|
||||
private var _decimals: Int?
|
||||
open var decimals: Int?
|
||||
{
|
||||
get { return _decimals }
|
||||
set
|
||||
{
|
||||
_decimals = newValue
|
||||
|
||||
if let digits = newValue
|
||||
{
|
||||
self.formatter?.minimumFractionDigits = digits
|
||||
self.formatter?.maximumFractionDigits = digits
|
||||
self.formatter?.usesGroupingSeparator = true
|
||||
}
|
||||
}
|
||||
}
|
||||
|
||||
public override init()
|
||||
{
|
||||
super.init()
|
||||
|
||||
self.formatter = NumberFormatter()
|
||||
hasAutoDecimals = true
|
||||
}
|
||||
|
||||
@objc public init(formatter: NumberFormatter)
|
||||
{
|
||||
super.init()
|
||||
|
||||
self.formatter = formatter
|
||||
}
|
||||
|
||||
@objc public init(decimals: Int)
|
||||
{
|
||||
super.init()
|
||||
|
||||
self.formatter = NumberFormatter()
|
||||
self.formatter?.usesGroupingSeparator = true
|
||||
self.decimals = decimals
|
||||
hasAutoDecimals = true
|
||||
}
|
||||
|
||||
@objc public init(block: @escaping Block)
|
||||
{
|
||||
super.init()
|
||||
|
||||
self.block = block
|
||||
}
|
||||
|
||||
@objc public static func with(block: @escaping Block) -> DefaultValueFormatter?
|
||||
{
|
||||
return DefaultValueFormatter(block: block)
|
||||
}
|
||||
|
||||
open func stringForValue(_ value: Double,
|
||||
entry: ChartDataEntry,
|
||||
dataSetIndex: Int,
|
||||
viewPortHandler: ViewPortHandler?) -> String
|
||||
{
|
||||
if let block = block {
|
||||
return block(value, entry, dataSetIndex, viewPortHandler)
|
||||
} else {
|
||||
return formatter?.string(from: NSNumber(floatLiteral: value)) ?? ""
|
||||
}
|
||||
}
|
||||
}
|
||||
30
Pods/Charts/Source/Charts/Formatters/IAxisValueFormatter.swift
generated
Normal file
30
Pods/Charts/Source/Charts/Formatters/IAxisValueFormatter.swift
generated
Normal file
@@ -0,0 +1,30 @@
|
||||
//
|
||||
// IAxisValueFormatter.swift
|
||||
// Charts
|
||||
//
|
||||
// Copyright 2015 Daniel Cohen Gindi & Philipp Jahoda
|
||||
// A port of MPAndroidChart for iOS
|
||||
// Licensed under Apache License 2.0
|
||||
//
|
||||
// https://github.com/danielgindi/Charts
|
||||
//
|
||||
|
||||
import Foundation
|
||||
|
||||
/// An interface for providing custom axis Strings.
|
||||
@objc(IChartAxisValueFormatter)
|
||||
public protocol IAxisValueFormatter: class
|
||||
{
|
||||
|
||||
/// Called when a value from an axis is formatted before being drawn.
|
||||
///
|
||||
/// For performance reasons, avoid excessive calculations and memory allocations inside this method.
|
||||
///
|
||||
/// - returns: The customized label that is drawn on the x-axis.
|
||||
/// - parameter value: the value that is currently being drawn
|
||||
/// - parameter axis: the axis that the value belongs to
|
||||
///
|
||||
func stringForValue(_ value: Double,
|
||||
axis: AxisBase?) -> String
|
||||
|
||||
}
|
||||
21
Pods/Charts/Source/Charts/Formatters/IFillFormatter.swift
generated
Normal file
21
Pods/Charts/Source/Charts/Formatters/IFillFormatter.swift
generated
Normal file
@@ -0,0 +1,21 @@
|
||||
//
|
||||
// IFillFormatter.swift
|
||||
// Charts
|
||||
//
|
||||
// Copyright 2015 Daniel Cohen Gindi & Philipp Jahoda
|
||||
// A port of MPAndroidChart for iOS
|
||||
// Licensed under Apache License 2.0
|
||||
//
|
||||
// https://github.com/danielgindi/Charts
|
||||
//
|
||||
|
||||
import Foundation
|
||||
import CoreGraphics
|
||||
|
||||
/// Protocol for providing a custom logic to where the filling line of a LineDataSet should end. This of course only works if setFillEnabled(...) is set to true.
|
||||
@objc(IChartFillFormatter)
|
||||
public protocol IFillFormatter
|
||||
{
|
||||
/// - returns: The vertical (y-axis) position where the filled-line of the LineDataSet should end.
|
||||
func getFillLinePosition(dataSet: ILineChartDataSet, dataProvider: LineChartDataProvider) -> CGFloat
|
||||
}
|
||||
41
Pods/Charts/Source/Charts/Formatters/IValueFormatter.swift
generated
Normal file
41
Pods/Charts/Source/Charts/Formatters/IValueFormatter.swift
generated
Normal file
@@ -0,0 +1,41 @@
|
||||
//
|
||||
// IValueFormatter.swift
|
||||
// Charts
|
||||
//
|
||||
// Copyright 2015 Daniel Cohen Gindi & Philipp Jahoda
|
||||
// A port of MPAndroidChart for iOS
|
||||
// Licensed under Apache License 2.0
|
||||
//
|
||||
// https://github.com/danielgindi/Charts
|
||||
//
|
||||
|
||||
import Foundation
|
||||
|
||||
/// Interface that allows custom formatting of all values inside the chart before they are being drawn to the screen.
|
||||
///
|
||||
/// Simply create your own formatting class and let it implement ValueFormatter.
|
||||
///
|
||||
/// Then override the getFormattedValue(...) method and return whatever you want.
|
||||
@objc(IChartValueFormatter)
|
||||
public protocol IValueFormatter: class
|
||||
{
|
||||
|
||||
/// Called when a value (from labels inside the chart) is formatted before being drawn.
|
||||
///
|
||||
/// For performance reasons, avoid excessive calculations and memory allocations inside this method.
|
||||
///
|
||||
/// - returns: The formatted label ready for being drawn
|
||||
///
|
||||
/// - parameter value: The value to be formatted
|
||||
///
|
||||
/// - parameter axis: The entry the value belongs to - in e.g. BarChart, this is of class BarEntry
|
||||
///
|
||||
/// - parameter dataSetIndex: The index of the DataSet the entry in focus belongs to
|
||||
///
|
||||
/// - parameter viewPortHandler: provides information about the current chart state (scale, translation, ...)
|
||||
///
|
||||
func stringForValue(_ value: Double,
|
||||
entry: ChartDataEntry,
|
||||
dataSetIndex: Int,
|
||||
viewPortHandler: ViewPortHandler?) -> String
|
||||
}
|
||||
59
Pods/Charts/Source/Charts/Formatters/IndexAxisValueFormatter.swift
generated
Normal file
59
Pods/Charts/Source/Charts/Formatters/IndexAxisValueFormatter.swift
generated
Normal file
@@ -0,0 +1,59 @@
|
||||
//
|
||||
// IndexAxisValueFormatter.swift
|
||||
// Charts
|
||||
//
|
||||
// Copyright 2015 Daniel Cohen Gindi & Philipp Jahoda
|
||||
// A port of MPAndroidChart for iOS
|
||||
// Licensed under Apache License 2.0
|
||||
//
|
||||
// https://github.com/danielgindi/Charts
|
||||
//
|
||||
|
||||
import Foundation
|
||||
|
||||
/// This formatter is used for passing an array of x-axis labels, on whole x steps.
|
||||
@objc(ChartIndexAxisValueFormatter)
|
||||
open class IndexAxisValueFormatter: NSObject, IAxisValueFormatter
|
||||
{
|
||||
private var _values: [String] = [String]()
|
||||
private var _valueCount: Int = 0
|
||||
|
||||
@objc public var values: [String]
|
||||
{
|
||||
get
|
||||
{
|
||||
return _values
|
||||
}
|
||||
set
|
||||
{
|
||||
_values = newValue
|
||||
_valueCount = _values.count
|
||||
}
|
||||
}
|
||||
|
||||
public override init()
|
||||
{
|
||||
super.init()
|
||||
|
||||
}
|
||||
|
||||
@objc public init(values: [String])
|
||||
{
|
||||
super.init()
|
||||
|
||||
self.values = values
|
||||
}
|
||||
|
||||
@objc public static func with(values: [String]) -> IndexAxisValueFormatter?
|
||||
{
|
||||
return IndexAxisValueFormatter(values: values)
|
||||
}
|
||||
|
||||
open func stringForValue(_ value: Double,
|
||||
axis: AxisBase?) -> String
|
||||
{
|
||||
let index = Int(value.rounded())
|
||||
guard values.indices.contains(index), index == Int(value) else { return "" }
|
||||
return _values[index]
|
||||
}
|
||||
}
|
||||
118
Pods/Charts/Source/Charts/Highlight/BarHighlighter.swift
generated
Normal file
118
Pods/Charts/Source/Charts/Highlight/BarHighlighter.swift
generated
Normal file
@@ -0,0 +1,118 @@
|
||||
//
|
||||
// BarHighlighter.swift
|
||||
// Charts
|
||||
//
|
||||
// Copyright 2015 Daniel Cohen Gindi & Philipp Jahoda
|
||||
// A port of MPAndroidChart for iOS
|
||||
// Licensed under Apache License 2.0
|
||||
//
|
||||
// https://github.com/danielgindi/Charts
|
||||
//
|
||||
|
||||
import Foundation
|
||||
import CoreGraphics
|
||||
|
||||
@objc(BarChartHighlighter)
|
||||
open class BarHighlighter: ChartHighlighter
|
||||
{
|
||||
open override func getHighlight(x: CGFloat, y: CGFloat) -> Highlight?
|
||||
{
|
||||
guard
|
||||
let barData = (self.chart as? BarChartDataProvider)?.barData,
|
||||
let high = super.getHighlight(x: x, y: y)
|
||||
else { return nil }
|
||||
|
||||
let pos = getValsForTouch(x: x, y: y)
|
||||
|
||||
if let set = barData.getDataSetByIndex(high.dataSetIndex) as? IBarChartDataSet,
|
||||
set.isStacked
|
||||
{
|
||||
return getStackedHighlight(high: high,
|
||||
set: set,
|
||||
xValue: Double(pos.x),
|
||||
yValue: Double(pos.y))
|
||||
}
|
||||
else
|
||||
{
|
||||
return high
|
||||
}
|
||||
}
|
||||
|
||||
internal override func getDistance(x1: CGFloat, y1: CGFloat, x2: CGFloat, y2: CGFloat) -> CGFloat
|
||||
{
|
||||
return abs(x1 - x2)
|
||||
}
|
||||
|
||||
internal override var data: ChartData?
|
||||
{
|
||||
return (chart as? BarChartDataProvider)?.barData
|
||||
}
|
||||
|
||||
/// This method creates the Highlight object that also indicates which value of a stacked BarEntry has been selected.
|
||||
/// - parameter high: the Highlight to work with looking for stacked values
|
||||
/// - parameter set:
|
||||
/// - parameter xIndex:
|
||||
/// - parameter yValue:
|
||||
/// - returns:
|
||||
@objc open func getStackedHighlight(high: Highlight,
|
||||
set: IBarChartDataSet,
|
||||
xValue: Double,
|
||||
yValue: Double) -> Highlight?
|
||||
{
|
||||
guard
|
||||
let chart = self.chart as? BarLineScatterCandleBubbleChartDataProvider,
|
||||
let entry = set.entryForXValue(xValue, closestToY: yValue) as? BarChartDataEntry
|
||||
else { return nil }
|
||||
|
||||
// Not stacked
|
||||
if entry.yValues == nil
|
||||
{
|
||||
return high
|
||||
}
|
||||
|
||||
guard
|
||||
let ranges = entry.ranges,
|
||||
ranges.count > 0
|
||||
else { return nil }
|
||||
|
||||
let stackIndex = getClosestStackIndex(ranges: ranges, value: yValue)
|
||||
let pixel = chart
|
||||
.getTransformer(forAxis: set.axisDependency)
|
||||
.pixelForValues(x: high.x, y: ranges[stackIndex].to)
|
||||
|
||||
return Highlight(x: entry.x,
|
||||
y: entry.y,
|
||||
xPx: pixel.x,
|
||||
yPx: pixel.y,
|
||||
dataSetIndex: high.dataSetIndex,
|
||||
stackIndex: stackIndex,
|
||||
axis: high.axis)
|
||||
}
|
||||
|
||||
/// - returns: The index of the closest value inside the values array / ranges (stacked barchart) to the value given as a parameter.
|
||||
/// - parameter entry:
|
||||
/// - parameter value:
|
||||
/// - returns:
|
||||
@objc open func getClosestStackIndex(ranges: [Range]?, value: Double) -> Int
|
||||
{
|
||||
guard let ranges = ranges else { return 0 }
|
||||
|
||||
var stackIndex = 0
|
||||
|
||||
for range in ranges
|
||||
{
|
||||
if range.contains(value)
|
||||
{
|
||||
return stackIndex
|
||||
}
|
||||
else
|
||||
{
|
||||
stackIndex += 1
|
||||
}
|
||||
}
|
||||
|
||||
let length = max(ranges.count - 1, 0)
|
||||
|
||||
return (value > ranges[length].to) ? length : 0
|
||||
}
|
||||
}
|
||||
188
Pods/Charts/Source/Charts/Highlight/ChartHighlighter.swift
generated
Normal file
188
Pods/Charts/Source/Charts/Highlight/ChartHighlighter.swift
generated
Normal file
@@ -0,0 +1,188 @@
|
||||
//
|
||||
// ChartHighlighter.swift
|
||||
// Charts
|
||||
//
|
||||
// Copyright 2015 Daniel Cohen Gindi & Philipp Jahoda
|
||||
// A port of MPAndroidChart for iOS
|
||||
// Licensed under Apache License 2.0
|
||||
//
|
||||
// https://github.com/danielgindi/Charts
|
||||
//
|
||||
|
||||
import Foundation
|
||||
import CoreGraphics
|
||||
|
||||
open class ChartHighlighter : NSObject, IHighlighter
|
||||
{
|
||||
/// instance of the data-provider
|
||||
@objc open weak var chart: ChartDataProvider?
|
||||
|
||||
@objc public init(chart: ChartDataProvider)
|
||||
{
|
||||
self.chart = chart
|
||||
}
|
||||
|
||||
open func getHighlight(x: CGFloat, y: CGFloat) -> Highlight?
|
||||
{
|
||||
let xVal = Double(getValsForTouch(x: x, y: y).x)
|
||||
return getHighlight(xValue: xVal, x: x, y: y)
|
||||
}
|
||||
|
||||
/// - returns: The corresponding x-pos for a given touch-position in pixels.
|
||||
/// - parameter x:
|
||||
/// - returns:
|
||||
@objc open func getValsForTouch(x: CGFloat, y: CGFloat) -> CGPoint
|
||||
{
|
||||
guard let chart = self.chart as? BarLineScatterCandleBubbleChartDataProvider else { return .zero }
|
||||
|
||||
// take any transformer to determine the values
|
||||
return chart.getTransformer(forAxis: .left).valueForTouchPoint(x: x, y: y)
|
||||
}
|
||||
|
||||
/// - returns: The corresponding ChartHighlight for a given x-value and xy-touch position in pixels.
|
||||
/// - parameter xValue:
|
||||
/// - parameter x:
|
||||
/// - parameter y:
|
||||
/// - returns:
|
||||
@objc open func getHighlight(xValue xVal: Double, x: CGFloat, y: CGFloat) -> Highlight?
|
||||
{
|
||||
guard let chart = chart else { return nil }
|
||||
|
||||
let closestValues = getHighlights(xValue: xVal, x: x, y: y)
|
||||
guard !closestValues.isEmpty else { return nil }
|
||||
|
||||
let leftAxisMinDist = getMinimumDistance(closestValues: closestValues, y: y, axis: .left)
|
||||
let rightAxisMinDist = getMinimumDistance(closestValues: closestValues, y: y, axis: .right)
|
||||
|
||||
let axis: YAxis.AxisDependency = leftAxisMinDist < rightAxisMinDist ? .left : .right
|
||||
|
||||
let detail = closestSelectionDetailByPixel(closestValues: closestValues, x: x, y: y, axis: axis, minSelectionDistance: chart.maxHighlightDistance)
|
||||
|
||||
return detail
|
||||
}
|
||||
|
||||
/// - returns: A list of Highlight objects representing the entries closest to the given xVal.
|
||||
/// The returned list contains two objects per DataSet (closest rounding up, closest rounding down).
|
||||
/// - parameter xValue: the transformed x-value of the x-touch position
|
||||
/// - parameter x: touch position
|
||||
/// - parameter y: touch position
|
||||
/// - returns:
|
||||
@objc open func getHighlights(xValue: Double, x: CGFloat, y: CGFloat) -> [Highlight]
|
||||
{
|
||||
var vals = [Highlight]()
|
||||
|
||||
guard let data = self.data else { return vals }
|
||||
|
||||
for i in 0 ..< data.dataSetCount
|
||||
{
|
||||
guard
|
||||
let dataSet = data.getDataSetByIndex(i),
|
||||
dataSet.isHighlightEnabled // don't include datasets that cannot be highlighted
|
||||
else { continue }
|
||||
|
||||
|
||||
// extract all y-values from all DataSets at the given x-value.
|
||||
// some datasets (i.e bubble charts) make sense to have multiple values for an x-value. We'll have to find a way to handle that later on. It's more complicated now when x-indices are floating point.
|
||||
vals.append(contentsOf: buildHighlights(dataSet: dataSet, dataSetIndex: i, xValue: xValue, rounding: .closest))
|
||||
}
|
||||
|
||||
return vals
|
||||
}
|
||||
|
||||
/// - returns: An array of `Highlight` objects corresponding to the selected xValue and dataSetIndex.
|
||||
internal func buildHighlights(
|
||||
dataSet set: IChartDataSet,
|
||||
dataSetIndex: Int,
|
||||
xValue: Double,
|
||||
rounding: ChartDataSetRounding) -> [Highlight]
|
||||
{
|
||||
var highlights = [Highlight]()
|
||||
|
||||
guard let chart = self.chart as? BarLineScatterCandleBubbleChartDataProvider else { return highlights }
|
||||
|
||||
var entries = set.entriesForXValue(xValue)
|
||||
if entries.count == 0, let closest = set.entryForXValue(xValue, closestToY: .nan, rounding: rounding)
|
||||
{
|
||||
// Try to find closest x-value and take all entries for that x-value
|
||||
entries = set.entriesForXValue(closest.x)
|
||||
}
|
||||
|
||||
for e in entries
|
||||
{
|
||||
let px = chart.getTransformer(forAxis: set.axisDependency).pixelForValues(x: e.x, y: e.y)
|
||||
|
||||
let highlight = Highlight(x: e.x, y: e.y, xPx: px.x, yPx: px.y, dataSetIndex: dataSetIndex, axis: set.axisDependency)
|
||||
highlights.append(highlight)
|
||||
}
|
||||
|
||||
return highlights
|
||||
}
|
||||
|
||||
// - MARK: - Utilities
|
||||
|
||||
/// - returns: The `ChartHighlight` of the closest value on the x-y cartesian axes
|
||||
internal func closestSelectionDetailByPixel(
|
||||
closestValues: [Highlight],
|
||||
x: CGFloat,
|
||||
y: CGFloat,
|
||||
axis: YAxis.AxisDependency?,
|
||||
minSelectionDistance: CGFloat) -> Highlight?
|
||||
{
|
||||
var distance = minSelectionDistance
|
||||
var closest: Highlight?
|
||||
|
||||
for high in closestValues
|
||||
{
|
||||
if axis == nil || high.axis == axis
|
||||
{
|
||||
let cDistance = getDistance(x1: x, y1: y, x2: high.xPx, y2: high.yPx)
|
||||
|
||||
if cDistance < distance
|
||||
{
|
||||
closest = high
|
||||
distance = cDistance
|
||||
}
|
||||
}
|
||||
}
|
||||
|
||||
return closest
|
||||
}
|
||||
|
||||
/// - returns: The minimum distance from a touch-y-value (in pixels) to the closest y-value (in pixels) that is displayed in the chart.
|
||||
internal func getMinimumDistance(
|
||||
closestValues: [Highlight],
|
||||
y: CGFloat,
|
||||
axis: YAxis.AxisDependency) -> CGFloat
|
||||
{
|
||||
var distance = CGFloat.greatestFiniteMagnitude
|
||||
|
||||
for high in closestValues
|
||||
{
|
||||
if high.axis == axis
|
||||
{
|
||||
let tempDistance = abs(getHighlightPos(high: high) - y)
|
||||
if tempDistance < distance
|
||||
{
|
||||
distance = tempDistance
|
||||
}
|
||||
}
|
||||
}
|
||||
|
||||
return distance
|
||||
}
|
||||
|
||||
internal func getHighlightPos(high: Highlight) -> CGFloat
|
||||
{
|
||||
return high.yPx
|
||||
}
|
||||
|
||||
internal func getDistance(x1: CGFloat, y1: CGFloat, x2: CGFloat, y2: CGFloat) -> CGFloat
|
||||
{
|
||||
return hypot(x1 - x2, y1 - y2)
|
||||
}
|
||||
|
||||
internal var data: ChartData?
|
||||
{
|
||||
return chart?.data
|
||||
}
|
||||
}
|
||||
70
Pods/Charts/Source/Charts/Highlight/CombinedHighlighter.swift
generated
Normal file
70
Pods/Charts/Source/Charts/Highlight/CombinedHighlighter.swift
generated
Normal file
@@ -0,0 +1,70 @@
|
||||
//
|
||||
// CombinedHighlighter.swift
|
||||
// Charts
|
||||
//
|
||||
// Copyright 2015 Daniel Cohen Gindi & Philipp Jahoda
|
||||
// A port of MPAndroidChart for iOS
|
||||
// Licensed under Apache License 2.0
|
||||
//
|
||||
// https://github.com/danielgindi/Charts
|
||||
//
|
||||
|
||||
import Foundation
|
||||
import CoreGraphics
|
||||
|
||||
@objc(CombinedChartHighlighter)
|
||||
open class CombinedHighlighter: ChartHighlighter
|
||||
{
|
||||
/// bar highlighter for supporting stacked highlighting
|
||||
private var barHighlighter: BarHighlighter?
|
||||
|
||||
@objc public init(chart: CombinedChartDataProvider, barDataProvider: BarChartDataProvider)
|
||||
{
|
||||
super.init(chart: chart)
|
||||
|
||||
// if there is BarData, create a BarHighlighter
|
||||
self.barHighlighter = barDataProvider.barData == nil ? nil : BarHighlighter(chart: barDataProvider)
|
||||
}
|
||||
|
||||
open override func getHighlights(xValue: Double, x: CGFloat, y: CGFloat) -> [Highlight]
|
||||
{
|
||||
var vals = [Highlight]()
|
||||
|
||||
guard
|
||||
let chart = self.chart as? CombinedChartDataProvider,
|
||||
let dataObjects = chart.combinedData?.allData
|
||||
else { return vals }
|
||||
|
||||
for i in 0..<dataObjects.count
|
||||
{
|
||||
let dataObject = dataObjects[i]
|
||||
|
||||
// in case of BarData, let the BarHighlighter take over
|
||||
if barHighlighter != nil && dataObject is BarChartData,
|
||||
let high = barHighlighter?.getHighlight(x: x, y: y)
|
||||
{
|
||||
high.dataIndex = i
|
||||
vals.append(high)
|
||||
}
|
||||
else
|
||||
{
|
||||
for j in 0..<dataObject.dataSetCount
|
||||
{
|
||||
guard let dataSet = dataObject.getDataSetByIndex(j),
|
||||
dataSet.isHighlightEnabled // don't include datasets that cannot be highlighted
|
||||
else { continue }
|
||||
|
||||
let highs = buildHighlights(dataSet: dataSet, dataSetIndex: j, xValue: xValue, rounding: .closest)
|
||||
|
||||
for high in highs
|
||||
{
|
||||
high.dataIndex = i
|
||||
vals.append(high)
|
||||
}
|
||||
}
|
||||
}
|
||||
}
|
||||
|
||||
return vals
|
||||
}
|
||||
}
|
||||
198
Pods/Charts/Source/Charts/Highlight/Highlight.swift
generated
Normal file
198
Pods/Charts/Source/Charts/Highlight/Highlight.swift
generated
Normal file
@@ -0,0 +1,198 @@
|
||||
//
|
||||
// Highlight.swift
|
||||
// Charts
|
||||
//
|
||||
// Copyright 2015 Daniel Cohen Gindi & Philipp Jahoda
|
||||
// A port of MPAndroidChart for iOS
|
||||
// Licensed under Apache License 2.0
|
||||
//
|
||||
// https://github.com/danielgindi/Charts
|
||||
//
|
||||
|
||||
import Foundation
|
||||
import CoreGraphics
|
||||
|
||||
@objc(ChartHighlight)
|
||||
open class Highlight: NSObject
|
||||
{
|
||||
/// the x-value of the highlighted value
|
||||
fileprivate var _x = Double.nan
|
||||
|
||||
/// the y-value of the highlighted value
|
||||
fileprivate var _y = Double.nan
|
||||
|
||||
/// the x-pixel of the highlight
|
||||
private var _xPx = CGFloat.nan
|
||||
|
||||
/// the y-pixel of the highlight
|
||||
private var _yPx = CGFloat.nan
|
||||
|
||||
/// the index of the data object - in case it refers to more than one
|
||||
@objc open var dataIndex = Int(-1)
|
||||
|
||||
/// the index of the dataset the highlighted value is in
|
||||
fileprivate var _dataSetIndex = Int(0)
|
||||
|
||||
/// index which value of a stacked bar entry is highlighted
|
||||
///
|
||||
/// **default**: -1
|
||||
fileprivate var _stackIndex = Int(-1)
|
||||
|
||||
/// the axis the highlighted value belongs to
|
||||
private var _axis: YAxis.AxisDependency = YAxis.AxisDependency.left
|
||||
|
||||
/// the x-position (pixels) on which this highlight object was last drawn
|
||||
@objc open var drawX: CGFloat = 0.0
|
||||
|
||||
/// the y-position (pixels) on which this highlight object was last drawn
|
||||
@objc open var drawY: CGFloat = 0.0
|
||||
|
||||
public override init()
|
||||
{
|
||||
super.init()
|
||||
}
|
||||
|
||||
/// - parameter x: the x-value of the highlighted value
|
||||
/// - parameter y: the y-value of the highlighted value
|
||||
/// - parameter xPx: the x-pixel of the highlighted value
|
||||
/// - parameter yPx: the y-pixel of the highlighted value
|
||||
/// - parameter dataIndex: the index of the Data the highlighted value belongs to
|
||||
/// - parameter dataSetIndex: the index of the DataSet the highlighted value belongs to
|
||||
/// - parameter stackIndex: references which value of a stacked-bar entry has been selected
|
||||
/// - parameter axis: the axis the highlighted value belongs to
|
||||
@objc public init(
|
||||
x: Double, y: Double,
|
||||
xPx: CGFloat, yPx: CGFloat,
|
||||
dataIndex: Int,
|
||||
dataSetIndex: Int,
|
||||
stackIndex: Int,
|
||||
axis: YAxis.AxisDependency)
|
||||
{
|
||||
super.init()
|
||||
|
||||
_x = x
|
||||
_y = y
|
||||
_xPx = xPx
|
||||
_yPx = yPx
|
||||
self.dataIndex = dataIndex
|
||||
_dataSetIndex = dataSetIndex
|
||||
_stackIndex = stackIndex
|
||||
_axis = axis
|
||||
}
|
||||
|
||||
/// - parameter x: the x-value of the highlighted value
|
||||
/// - parameter y: the y-value of the highlighted value
|
||||
/// - parameter xPx: the x-pixel of the highlighted value
|
||||
/// - parameter yPx: the y-pixel of the highlighted value
|
||||
/// - parameter dataSetIndex: the index of the DataSet the highlighted value belongs to
|
||||
/// - parameter stackIndex: references which value of a stacked-bar entry has been selected
|
||||
/// - parameter axis: the axis the highlighted value belongs to
|
||||
@objc public convenience init(
|
||||
x: Double, y: Double,
|
||||
xPx: CGFloat, yPx: CGFloat,
|
||||
dataSetIndex: Int,
|
||||
stackIndex: Int,
|
||||
axis: YAxis.AxisDependency)
|
||||
{
|
||||
self.init(x: x, y: y, xPx: xPx, yPx: yPx,
|
||||
dataIndex: 0,
|
||||
dataSetIndex: dataSetIndex,
|
||||
stackIndex: stackIndex,
|
||||
axis: axis)
|
||||
}
|
||||
|
||||
/// - parameter x: the x-value of the highlighted value
|
||||
/// - parameter y: the y-value of the highlighted value
|
||||
/// - parameter xPx: the x-pixel of the highlighted value
|
||||
/// - parameter yPx: the y-pixel of the highlighted value
|
||||
/// - parameter dataIndex: the index of the Data the highlighted value belongs to
|
||||
/// - parameter dataSetIndex: the index of the DataSet the highlighted value belongs to
|
||||
/// - parameter stackIndex: references which value of a stacked-bar entry has been selected
|
||||
/// - parameter axis: the axis the highlighted value belongs to
|
||||
@objc public init(
|
||||
x: Double, y: Double,
|
||||
xPx: CGFloat, yPx: CGFloat,
|
||||
dataSetIndex: Int,
|
||||
axis: YAxis.AxisDependency)
|
||||
{
|
||||
super.init()
|
||||
|
||||
_x = x
|
||||
_y = y
|
||||
_xPx = xPx
|
||||
_yPx = yPx
|
||||
_dataSetIndex = dataSetIndex
|
||||
_axis = axis
|
||||
}
|
||||
|
||||
/// - parameter x: the x-value of the highlighted value
|
||||
/// - parameter y: the y-value of the highlighted value
|
||||
/// - parameter dataSetIndex: the index of the DataSet the highlighted value belongs to
|
||||
/// - parameter dataIndex: The data index to search in (only used in CombinedChartView currently)
|
||||
@objc public init(x: Double, y: Double, dataSetIndex: Int, dataIndex: Int = -1)
|
||||
{
|
||||
_x = x
|
||||
_y = y
|
||||
_dataSetIndex = dataSetIndex
|
||||
self.dataIndex = dataIndex
|
||||
}
|
||||
|
||||
/// - parameter x: the x-value of the highlighted value
|
||||
/// - parameter dataSetIndex: the index of the DataSet the highlighted value belongs to
|
||||
/// - parameter stackIndex: references which value of a stacked-bar entry has been selected
|
||||
@objc public convenience init(x: Double, dataSetIndex: Int, stackIndex: Int)
|
||||
{
|
||||
self.init(x: x, y: Double.nan, dataSetIndex: dataSetIndex)
|
||||
_stackIndex = stackIndex
|
||||
}
|
||||
|
||||
@objc open var x: Double { return _x }
|
||||
@objc open var y: Double { return _y }
|
||||
@objc open var xPx: CGFloat { return _xPx }
|
||||
@objc open var yPx: CGFloat { return _yPx }
|
||||
@objc open var dataSetIndex: Int { return _dataSetIndex }
|
||||
@objc open var stackIndex: Int { return _stackIndex }
|
||||
@objc open var axis: YAxis.AxisDependency { return _axis }
|
||||
|
||||
@objc open var isStacked: Bool { return _stackIndex >= 0 }
|
||||
|
||||
/// Sets the x- and y-position (pixels) where this highlight was last drawn.
|
||||
@objc open func setDraw(x: CGFloat, y: CGFloat)
|
||||
{
|
||||
self.drawX = x
|
||||
self.drawY = y
|
||||
}
|
||||
|
||||
/// Sets the x- and y-position (pixels) where this highlight was last drawn.
|
||||
@objc open func setDraw(pt: CGPoint)
|
||||
{
|
||||
self.drawX = pt.x
|
||||
self.drawY = pt.y
|
||||
}
|
||||
|
||||
// MARK: NSObject
|
||||
|
||||
open override var description: String
|
||||
{
|
||||
return "Highlight, x: \(_x), y: \(_y), dataIndex (combined charts): \(dataIndex), dataSetIndex: \(_dataSetIndex), stackIndex (only stacked barentry): \(_stackIndex)"
|
||||
}
|
||||
}
|
||||
|
||||
|
||||
// MARK: Equatable
|
||||
extension Highlight /*: Equatable*/ {
|
||||
open override func isEqual(_ object: Any?) -> Bool {
|
||||
guard let object = object as? Highlight else { return false }
|
||||
|
||||
if self === object
|
||||
{
|
||||
return true
|
||||
}
|
||||
|
||||
return _x == object._x
|
||||
&& _y == object._y
|
||||
&& dataIndex == object.dataIndex
|
||||
&& _dataSetIndex == object._dataSetIndex
|
||||
&& _stackIndex == object._stackIndex
|
||||
}
|
||||
}
|
||||
68
Pods/Charts/Source/Charts/Highlight/HorizontalBarHighlighter.swift
generated
Normal file
68
Pods/Charts/Source/Charts/Highlight/HorizontalBarHighlighter.swift
generated
Normal file
@@ -0,0 +1,68 @@
|
||||
//
|
||||
// HorizontalBarHighlighter.swift
|
||||
// Charts
|
||||
//
|
||||
// Copyright 2015 Daniel Cohen Gindi & Philipp Jahoda
|
||||
// A port of MPAndroidChart for iOS
|
||||
// Licensed under Apache License 2.0
|
||||
//
|
||||
// https://github.com/danielgindi/Charts
|
||||
//
|
||||
|
||||
import Foundation
|
||||
import CoreGraphics
|
||||
|
||||
@objc(HorizontalBarChartHighlighter)
|
||||
open class HorizontalBarHighlighter: BarHighlighter
|
||||
{
|
||||
open override func getHighlight(x: CGFloat, y: CGFloat) -> Highlight?
|
||||
{
|
||||
guard let barData = self.chart?.data as? BarChartData else { return nil }
|
||||
|
||||
let pos = getValsForTouch(x: y, y: x)
|
||||
guard let high = getHighlight(xValue: Double(pos.y), x: y, y: x) else { return nil }
|
||||
|
||||
if let set = barData.getDataSetByIndex(high.dataSetIndex) as? IBarChartDataSet,
|
||||
set.isStacked
|
||||
{
|
||||
return getStackedHighlight(high: high,
|
||||
set: set,
|
||||
xValue: Double(pos.y),
|
||||
yValue: Double(pos.x))
|
||||
}
|
||||
|
||||
return high
|
||||
}
|
||||
|
||||
internal override func buildHighlights(
|
||||
dataSet set: IChartDataSet,
|
||||
dataSetIndex: Int,
|
||||
xValue: Double,
|
||||
rounding: ChartDataSetRounding) -> [Highlight]
|
||||
{
|
||||
var highlights = [Highlight]()
|
||||
|
||||
guard let chart = self.chart as? BarLineScatterCandleBubbleChartDataProvider else { return highlights }
|
||||
|
||||
var entries = set.entriesForXValue(xValue)
|
||||
if entries.count == 0, let closest = set.entryForXValue(xValue, closestToY: .nan, rounding: rounding)
|
||||
{
|
||||
// Try to find closest x-value and take all entries for that x-value
|
||||
entries = set.entriesForXValue(closest.x)
|
||||
}
|
||||
|
||||
for e in entries
|
||||
{
|
||||
let px = chart.getTransformer(forAxis: set.axisDependency).pixelForValues(x: e.y, y: e.x)
|
||||
|
||||
highlights.append(Highlight(x: e.x, y: e.y, xPx: px.x, yPx: px.y, dataSetIndex: dataSetIndex, axis: set.axisDependency))
|
||||
}
|
||||
|
||||
return highlights
|
||||
}
|
||||
|
||||
internal override func getDistance(x1: CGFloat, y1: CGFloat, x2: CGFloat, y2: CGFloat) -> CGFloat
|
||||
{
|
||||
return abs(y1 - y2)
|
||||
}
|
||||
}
|
||||
23
Pods/Charts/Source/Charts/Highlight/IHighlighter.swift
generated
Normal file
23
Pods/Charts/Source/Charts/Highlight/IHighlighter.swift
generated
Normal file
@@ -0,0 +1,23 @@
|
||||
//
|
||||
// IHighlighter.swift
|
||||
// Charts
|
||||
//
|
||||
// Copyright 2015 Daniel Cohen Gindi & Philipp Jahoda
|
||||
// A port of MPAndroidChart for iOS
|
||||
// Licensed under Apache License 2.0
|
||||
//
|
||||
// https://github.com/danielgindi/Charts
|
||||
//
|
||||
|
||||
import Foundation
|
||||
import CoreGraphics
|
||||
|
||||
@objc(IChartHighlighter)
|
||||
public protocol IHighlighter: class
|
||||
{
|
||||
/// - returns: A Highlight object corresponding to the given x- and y- touch positions in pixels.
|
||||
/// - parameter x:
|
||||
/// - parameter y:
|
||||
/// - returns:
|
||||
func getHighlight(x: CGFloat, y: CGFloat) -> Highlight?
|
||||
}
|
||||
27
Pods/Charts/Source/Charts/Highlight/PieHighlighter.swift
generated
Normal file
27
Pods/Charts/Source/Charts/Highlight/PieHighlighter.swift
generated
Normal file
@@ -0,0 +1,27 @@
|
||||
//
|
||||
// PieHighlighter.swift
|
||||
// Charts
|
||||
//
|
||||
// Copyright 2015 Daniel Cohen Gindi & Philipp Jahoda
|
||||
// A port of MPAndroidChart for iOS
|
||||
// Licensed under Apache License 2.0
|
||||
//
|
||||
// https://github.com/danielgindi/Charts
|
||||
//
|
||||
|
||||
import Foundation
|
||||
import CoreGraphics
|
||||
|
||||
@objc(PieChartHighlighter)
|
||||
open class PieHighlighter: PieRadarHighlighter
|
||||
{
|
||||
open override func closestHighlight(index: Int, x: CGFloat, y: CGFloat) -> Highlight?
|
||||
{
|
||||
guard
|
||||
let set = chart?.data?.dataSets[0],
|
||||
let entry = set.entryForIndex(index)
|
||||
else { return nil }
|
||||
|
||||
return Highlight(x: Double(index), y: entry.y, xPx: x, yPx: y, dataSetIndex: 0, axis: set.axisDependency)
|
||||
}
|
||||
}
|
||||
60
Pods/Charts/Source/Charts/Highlight/PieRadarHighlighter.swift
generated
Normal file
60
Pods/Charts/Source/Charts/Highlight/PieRadarHighlighter.swift
generated
Normal file
@@ -0,0 +1,60 @@
|
||||
//
|
||||
// PieRadarHighlighter.swift
|
||||
// Charts
|
||||
//
|
||||
// Copyright 2015 Daniel Cohen Gindi & Philipp Jahoda
|
||||
// A port of MPAndroidChart for iOS
|
||||
// Licensed under Apache License 2.0
|
||||
//
|
||||
// https://github.com/danielgindi/Charts
|
||||
//
|
||||
|
||||
import Foundation
|
||||
import CoreGraphics
|
||||
|
||||
@objc(PieRadarChartHighlighter)
|
||||
open class PieRadarHighlighter: ChartHighlighter
|
||||
{
|
||||
open override func getHighlight(x: CGFloat, y: CGFloat) -> Highlight?
|
||||
{
|
||||
guard let chart = self.chart as? PieRadarChartViewBase else { return nil }
|
||||
|
||||
let touchDistanceToCenter = chart.distanceToCenter(x: x, y: y)
|
||||
|
||||
// check if a slice was touched
|
||||
guard touchDistanceToCenter <= chart.radius else
|
||||
{
|
||||
// if no slice was touched, highlight nothing
|
||||
return nil
|
||||
}
|
||||
|
||||
var angle = chart.angleForPoint(x: x ,y: y)
|
||||
|
||||
if chart is PieChartView
|
||||
{
|
||||
angle /= CGFloat(chart.chartAnimator.phaseY)
|
||||
}
|
||||
|
||||
let index = chart.indexForAngle(angle)
|
||||
|
||||
// check if the index could be found
|
||||
if index < 0 || index >= chart.data?.maxEntryCountSet?.entryCount ?? 0
|
||||
{
|
||||
return nil
|
||||
}
|
||||
else
|
||||
{
|
||||
return closestHighlight(index: index, x: x, y: y)
|
||||
}
|
||||
|
||||
}
|
||||
|
||||
/// - returns: The closest Highlight object of the given objects based on the touch position inside the chart.
|
||||
/// - parameter index:
|
||||
/// - parameter x:
|
||||
/// - parameter y:
|
||||
@objc open func closestHighlight(index: Int, x: CGFloat, y: CGFloat) -> Highlight?
|
||||
{
|
||||
fatalError("closestHighlight(index, x, y) cannot be called on PieRadarChartHighlighter")
|
||||
}
|
||||
}
|
||||
78
Pods/Charts/Source/Charts/Highlight/RadarHighlighter.swift
generated
Normal file
78
Pods/Charts/Source/Charts/Highlight/RadarHighlighter.swift
generated
Normal file
@@ -0,0 +1,78 @@
|
||||
//
|
||||
// RadarHighlighter.swift
|
||||
// Charts
|
||||
//
|
||||
// Copyright 2015 Daniel Cohen Gindi & Philipp Jahoda
|
||||
// A port of MPAndroidChart for iOS
|
||||
// Licensed under Apache License 2.0
|
||||
//
|
||||
// https://github.com/danielgindi/Charts
|
||||
//
|
||||
|
||||
import Foundation
|
||||
import CoreGraphics
|
||||
|
||||
@objc(RadarChartHighlighter)
|
||||
open class RadarHighlighter: PieRadarHighlighter
|
||||
{
|
||||
open override func closestHighlight(index: Int, x: CGFloat, y: CGFloat) -> Highlight?
|
||||
{
|
||||
guard let chart = self.chart as? RadarChartView else { return nil }
|
||||
|
||||
let highlights = getHighlights(forIndex: index)
|
||||
|
||||
let distanceToCenter = Double(chart.distanceToCenter(x: x, y: y) / chart.factor)
|
||||
|
||||
var closest: Highlight?
|
||||
var distance = Double.greatestFiniteMagnitude
|
||||
|
||||
for high in highlights
|
||||
{
|
||||
let cdistance = abs(high.y - distanceToCenter)
|
||||
if cdistance < distance
|
||||
{
|
||||
closest = high
|
||||
distance = cdistance
|
||||
}
|
||||
}
|
||||
|
||||
return closest
|
||||
}
|
||||
|
||||
/// - returns: An array of Highlight objects for the given index.
|
||||
/// The Highlight objects give information about the value at the selected index and DataSet it belongs to.
|
||||
///
|
||||
/// - parameter index:
|
||||
internal func getHighlights(forIndex index: Int) -> [Highlight]
|
||||
{
|
||||
var vals = [Highlight]()
|
||||
|
||||
guard
|
||||
let chart = self.chart as? RadarChartView,
|
||||
let chartData = chart.data
|
||||
else { return vals }
|
||||
|
||||
let phaseX = chart.chartAnimator.phaseX
|
||||
let phaseY = chart.chartAnimator.phaseY
|
||||
let sliceangle = chart.sliceAngle
|
||||
let factor = chart.factor
|
||||
|
||||
for i in chartData.dataSets.indices
|
||||
{
|
||||
guard
|
||||
let dataSet = chartData.getDataSetByIndex(i),
|
||||
let entry = dataSet.entryForIndex(index)
|
||||
else { continue }
|
||||
|
||||
let y = (entry.y - chart.chartYMin)
|
||||
|
||||
let p = chart.centerOffsets.moving(distance: CGFloat(y) * factor * CGFloat(phaseY),
|
||||
atAngle: sliceangle * CGFloat(index) * CGFloat(phaseX) + chart.rotationAngle)
|
||||
|
||||
let highlight = Highlight(x: Double(index), y: entry.y, xPx: p.x, yPx: p.y, dataSetIndex: i, axis: dataSet.axisDependency)
|
||||
vals.append(highlight)
|
||||
}
|
||||
|
||||
return vals
|
||||
}
|
||||
}
|
||||
51
Pods/Charts/Source/Charts/Highlight/Range.swift
generated
Normal file
51
Pods/Charts/Source/Charts/Highlight/Range.swift
generated
Normal file
@@ -0,0 +1,51 @@
|
||||
//
|
||||
// Range.swift
|
||||
// Charts
|
||||
//
|
||||
// Copyright 2015 Daniel Cohen Gindi & Philipp Jahoda
|
||||
// A port of MPAndroidChart for iOS
|
||||
// Licensed under Apache License 2.0
|
||||
//
|
||||
// https://github.com/danielgindi/Charts
|
||||
//
|
||||
|
||||
import Foundation
|
||||
|
||||
@objc(ChartRange)
|
||||
open class Range: NSObject
|
||||
{
|
||||
@objc open var from: Double
|
||||
@objc open var to: Double
|
||||
|
||||
@objc public init(from: Double, to: Double)
|
||||
{
|
||||
self.from = from
|
||||
self.to = to
|
||||
|
||||
super.init()
|
||||
}
|
||||
|
||||
/// - returns: `true` if this range contains (if the value is in between) the given value, `false` ifnot.
|
||||
/// - parameter value:
|
||||
@objc open func contains(_ value: Double) -> Bool
|
||||
{
|
||||
if value > from && value <= to
|
||||
{
|
||||
return true
|
||||
}
|
||||
else
|
||||
{
|
||||
return false
|
||||
}
|
||||
}
|
||||
|
||||
@objc open func isLarger(_ value: Double) -> Bool
|
||||
{
|
||||
return value > to
|
||||
}
|
||||
|
||||
@objc open func isSmaller(_ value: Double) -> Bool
|
||||
{
|
||||
return value < from
|
||||
}
|
||||
}
|
||||
23
Pods/Charts/Source/Charts/Interfaces/BarChartDataProvider.swift
generated
Normal file
23
Pods/Charts/Source/Charts/Interfaces/BarChartDataProvider.swift
generated
Normal file
@@ -0,0 +1,23 @@
|
||||
//
|
||||
// BarChartDataProvider.swift
|
||||
// Charts
|
||||
//
|
||||
// Copyright 2015 Daniel Cohen Gindi & Philipp Jahoda
|
||||
// A port of MPAndroidChart for iOS
|
||||
// Licensed under Apache License 2.0
|
||||
//
|
||||
// https://github.com/danielgindi/Charts
|
||||
//
|
||||
|
||||
import Foundation
|
||||
import CoreGraphics
|
||||
|
||||
@objc
|
||||
public protocol BarChartDataProvider: BarLineScatterCandleBubbleChartDataProvider
|
||||
{
|
||||
var barData: BarChartData? { get }
|
||||
|
||||
var isDrawBarShadowEnabled: Bool { get }
|
||||
var isDrawValueAboveBarEnabled: Bool { get }
|
||||
var isHighlightFullBarEnabled: Bool { get }
|
||||
}
|
||||
23
Pods/Charts/Source/Charts/Interfaces/BarLineScatterCandleBubbleChartDataProvider.swift
generated
Normal file
23
Pods/Charts/Source/Charts/Interfaces/BarLineScatterCandleBubbleChartDataProvider.swift
generated
Normal file
@@ -0,0 +1,23 @@
|
||||
//
|
||||
// BarLineScatterCandleBubbleChartDataProvider.swift
|
||||
// Charts
|
||||
//
|
||||
// Copyright 2015 Daniel Cohen Gindi & Philipp Jahoda
|
||||
// A port of MPAndroidChart for iOS
|
||||
// Licensed under Apache License 2.0
|
||||
//
|
||||
// https://github.com/danielgindi/Charts
|
||||
//
|
||||
|
||||
import Foundation
|
||||
import CoreGraphics
|
||||
|
||||
@objc
|
||||
public protocol BarLineScatterCandleBubbleChartDataProvider: ChartDataProvider
|
||||
{
|
||||
func getTransformer(forAxis: YAxis.AxisDependency) -> Transformer
|
||||
func isInverted(axis: YAxis.AxisDependency) -> Bool
|
||||
|
||||
var lowestVisibleX: Double { get }
|
||||
var highestVisibleX: Double { get }
|
||||
}
|
||||
19
Pods/Charts/Source/Charts/Interfaces/BubbleChartDataProvider.swift
generated
Normal file
19
Pods/Charts/Source/Charts/Interfaces/BubbleChartDataProvider.swift
generated
Normal file
@@ -0,0 +1,19 @@
|
||||
//
|
||||
// BubbleChartDataProvider.swift
|
||||
// Charts
|
||||
//
|
||||
// Copyright 2015 Daniel Cohen Gindi & Philipp Jahoda
|
||||
// A port of MPAndroidChart for iOS
|
||||
// Licensed under Apache License 2.0
|
||||
//
|
||||
// https://github.com/danielgindi/Charts
|
||||
//
|
||||
|
||||
import Foundation
|
||||
import CoreGraphics
|
||||
|
||||
@objc
|
||||
public protocol BubbleChartDataProvider: BarLineScatterCandleBubbleChartDataProvider
|
||||
{
|
||||
var bubbleData: BubbleChartData? { get }
|
||||
}
|
||||
19
Pods/Charts/Source/Charts/Interfaces/CandleChartDataProvider.swift
generated
Normal file
19
Pods/Charts/Source/Charts/Interfaces/CandleChartDataProvider.swift
generated
Normal file
@@ -0,0 +1,19 @@
|
||||
//
|
||||
// CandleChartDataProvider.swift
|
||||
// Charts
|
||||
//
|
||||
// Copyright 2015 Daniel Cohen Gindi & Philipp Jahoda
|
||||
// A port of MPAndroidChart for iOS
|
||||
// Licensed under Apache License 2.0
|
||||
//
|
||||
// https://github.com/danielgindi/Charts
|
||||
//
|
||||
|
||||
import Foundation
|
||||
import CoreGraphics
|
||||
|
||||
@objc
|
||||
public protocol CandleChartDataProvider: BarLineScatterCandleBubbleChartDataProvider
|
||||
{
|
||||
var candleData: CandleChartData? { get }
|
||||
}
|
||||
39
Pods/Charts/Source/Charts/Interfaces/ChartDataProvider.swift
generated
Normal file
39
Pods/Charts/Source/Charts/Interfaces/ChartDataProvider.swift
generated
Normal file
@@ -0,0 +1,39 @@
|
||||
//
|
||||
// ChartDataProvider.swift
|
||||
// Charts
|
||||
//
|
||||
// Copyright 2015 Daniel Cohen Gindi & Philipp Jahoda
|
||||
// A port of MPAndroidChart for iOS
|
||||
// Licensed under Apache License 2.0
|
||||
//
|
||||
// https://github.com/danielgindi/Charts
|
||||
//
|
||||
|
||||
import Foundation
|
||||
import CoreGraphics
|
||||
|
||||
@objc
|
||||
public protocol ChartDataProvider
|
||||
{
|
||||
/// - returns: The minimum x-value of the chart, regardless of zoom or translation.
|
||||
var chartXMin: Double { get }
|
||||
|
||||
/// - returns: The maximum x-value of the chart, regardless of zoom or translation.
|
||||
var chartXMax: Double { get }
|
||||
|
||||
/// - returns: The minimum y-value of the chart, regardless of zoom or translation.
|
||||
var chartYMin: Double { get }
|
||||
|
||||
/// - returns: The maximum y-value of the chart, regardless of zoom or translation.
|
||||
var chartYMax: Double { get }
|
||||
|
||||
var maxHighlightDistance: CGFloat { get }
|
||||
|
||||
var xRange: Double { get }
|
||||
|
||||
var centerOffsets: CGPoint { get }
|
||||
|
||||
var data: ChartData? { get }
|
||||
|
||||
var maxVisibleCount: Int { get }
|
||||
}
|
||||
19
Pods/Charts/Source/Charts/Interfaces/CombinedChartDataProvider.swift
generated
Normal file
19
Pods/Charts/Source/Charts/Interfaces/CombinedChartDataProvider.swift
generated
Normal file
@@ -0,0 +1,19 @@
|
||||
//
|
||||
// CombinedChartDataProvider.swoft
|
||||
// Charts
|
||||
//
|
||||
// Copyright 2015 Daniel Cohen Gindi & Philipp Jahoda
|
||||
// A port of MPAndroidChart for iOS
|
||||
// Licensed under Apache License 2.0
|
||||
//
|
||||
// https://github.com/danielgindi/Charts
|
||||
//
|
||||
|
||||
import Foundation
|
||||
import CoreGraphics
|
||||
|
||||
@objc
|
||||
public protocol CombinedChartDataProvider: LineChartDataProvider, BarChartDataProvider, BubbleChartDataProvider, CandleChartDataProvider, ScatterChartDataProvider
|
||||
{
|
||||
var combinedData: CombinedChartData? { get }
|
||||
}
|
||||
21
Pods/Charts/Source/Charts/Interfaces/LineChartDataProvider.swift
generated
Normal file
21
Pods/Charts/Source/Charts/Interfaces/LineChartDataProvider.swift
generated
Normal file
@@ -0,0 +1,21 @@
|
||||
//
|
||||
// LineChartDataProvider.swift
|
||||
// Charts
|
||||
//
|
||||
// Copyright 2015 Daniel Cohen Gindi & Philipp Jahoda
|
||||
// A port of MPAndroidChart for iOS
|
||||
// Licensed under Apache License 2.0
|
||||
//
|
||||
// https://github.com/danielgindi/Charts
|
||||
//
|
||||
|
||||
import Foundation
|
||||
import CoreGraphics
|
||||
|
||||
@objc
|
||||
public protocol LineChartDataProvider: BarLineScatterCandleBubbleChartDataProvider
|
||||
{
|
||||
var lineData: LineChartData? { get }
|
||||
|
||||
func getAxis(_ axis: YAxis.AxisDependency) -> YAxis
|
||||
}
|
||||
19
Pods/Charts/Source/Charts/Interfaces/ScatterChartDataProvider.swift
generated
Normal file
19
Pods/Charts/Source/Charts/Interfaces/ScatterChartDataProvider.swift
generated
Normal file
@@ -0,0 +1,19 @@
|
||||
//
|
||||
// ScatterChartDataProvider.swift
|
||||
// Charts
|
||||
//
|
||||
// Copyright 2015 Daniel Cohen Gindi & Philipp Jahoda
|
||||
// A port of MPAndroidChart for iOS
|
||||
// Licensed under Apache License 2.0
|
||||
//
|
||||
// https://github.com/danielgindi/Charts
|
||||
//
|
||||
|
||||
import Foundation
|
||||
import CoreGraphics
|
||||
|
||||
@objc
|
||||
public protocol ScatterChartDataProvider: BarLineScatterCandleBubbleChartDataProvider
|
||||
{
|
||||
var scatterData: ScatterChartData? { get }
|
||||
}
|
||||
37
Pods/Charts/Source/Charts/Jobs/AnimatedMoveViewJob.swift
generated
Normal file
37
Pods/Charts/Source/Charts/Jobs/AnimatedMoveViewJob.swift
generated
Normal file
@@ -0,0 +1,37 @@
|
||||
//
|
||||
// AnimatedMoveViewJob.swift
|
||||
// Charts
|
||||
//
|
||||
// Copyright 2015 Daniel Cohen Gindi & Philipp Jahoda
|
||||
// A port of MPAndroidChart for iOS
|
||||
// Licensed under Apache License 2.0
|
||||
//
|
||||
// https://github.com/danielgindi/Charts
|
||||
//
|
||||
|
||||
import Foundation
|
||||
import CoreGraphics
|
||||
|
||||
#if !os(OSX)
|
||||
import UIKit
|
||||
#endif
|
||||
|
||||
open class AnimatedMoveViewJob: AnimatedViewPortJob
|
||||
{
|
||||
internal override func animationUpdate()
|
||||
{
|
||||
guard
|
||||
let viewPortHandler = viewPortHandler,
|
||||
let transformer = transformer,
|
||||
let view = view
|
||||
else { return }
|
||||
|
||||
var pt = CGPoint(
|
||||
x: xOrigin + (CGFloat(xValue) - xOrigin) * phase,
|
||||
y: yOrigin + (CGFloat(yValue) - yOrigin) * phase
|
||||
)
|
||||
|
||||
transformer.pointValueToPixel(&pt)
|
||||
viewPortHandler.centerViewPort(pt: pt, chart: view)
|
||||
}
|
||||
}
|
||||
130
Pods/Charts/Source/Charts/Jobs/AnimatedViewPortJob.swift
generated
Normal file
130
Pods/Charts/Source/Charts/Jobs/AnimatedViewPortJob.swift
generated
Normal file
@@ -0,0 +1,130 @@
|
||||
//
|
||||
// AnimatedViewPortJob.swift
|
||||
// Charts
|
||||
//
|
||||
// Copyright 2015 Daniel Cohen Gindi & Philipp Jahoda
|
||||
// A port of MPAndroidChart for iOS
|
||||
// Licensed under Apache License 2.0
|
||||
//
|
||||
// https://github.com/danielgindi/Charts
|
||||
//
|
||||
|
||||
import Foundation
|
||||
import CoreGraphics
|
||||
|
||||
#if !os(OSX)
|
||||
import UIKit
|
||||
#endif
|
||||
|
||||
open class AnimatedViewPortJob: ViewPortJob
|
||||
{
|
||||
internal var phase: CGFloat = 1.0
|
||||
internal var xOrigin: CGFloat = 0.0
|
||||
internal var yOrigin: CGFloat = 0.0
|
||||
|
||||
private var _startTime: TimeInterval = 0.0
|
||||
private var _displayLink: NSUIDisplayLink!
|
||||
private var _duration: TimeInterval = 0.0
|
||||
private var _endTime: TimeInterval = 0.0
|
||||
|
||||
private var _easing: ChartEasingFunctionBlock?
|
||||
|
||||
@objc public init(
|
||||
viewPortHandler: ViewPortHandler,
|
||||
xValue: Double,
|
||||
yValue: Double,
|
||||
transformer: Transformer,
|
||||
view: ChartViewBase,
|
||||
xOrigin: CGFloat,
|
||||
yOrigin: CGFloat,
|
||||
duration: TimeInterval,
|
||||
easing: ChartEasingFunctionBlock?)
|
||||
{
|
||||
super.init(viewPortHandler: viewPortHandler,
|
||||
xValue: xValue,
|
||||
yValue: yValue,
|
||||
transformer: transformer,
|
||||
view: view)
|
||||
|
||||
self.xOrigin = xOrigin
|
||||
self.yOrigin = yOrigin
|
||||
self._duration = duration
|
||||
self._easing = easing
|
||||
}
|
||||
|
||||
deinit
|
||||
{
|
||||
stop(finish: false)
|
||||
}
|
||||
|
||||
open override func doJob()
|
||||
{
|
||||
start()
|
||||
}
|
||||
|
||||
@objc open func start()
|
||||
{
|
||||
_startTime = CACurrentMediaTime()
|
||||
_endTime = _startTime + _duration
|
||||
_endTime = _endTime > _endTime ? _endTime : _endTime
|
||||
|
||||
updateAnimationPhase(_startTime)
|
||||
|
||||
_displayLink = NSUIDisplayLink(target: self, selector: #selector(animationLoop))
|
||||
_displayLink.add(to: .main, forMode: .commonModes)
|
||||
}
|
||||
|
||||
@objc open func stop(finish: Bool)
|
||||
{
|
||||
guard _displayLink != nil else { return }
|
||||
|
||||
_displayLink.remove(from: .main, forMode: .commonModes)
|
||||
_displayLink = nil
|
||||
|
||||
if finish
|
||||
{
|
||||
if phase != 1.0
|
||||
{
|
||||
phase = 1.0
|
||||
animationUpdate()
|
||||
}
|
||||
|
||||
animationEnd()
|
||||
}
|
||||
}
|
||||
|
||||
private func updateAnimationPhase(_ currentTime: TimeInterval)
|
||||
{
|
||||
let elapsedTime = currentTime - _startTime
|
||||
let duration = _duration
|
||||
var elapsed = elapsedTime
|
||||
|
||||
elapsed = min(elapsed, duration)
|
||||
|
||||
phase = CGFloat(_easing?(elapsed, duration) ?? elapsed / duration)
|
||||
}
|
||||
|
||||
@objc private func animationLoop()
|
||||
{
|
||||
let currentTime: TimeInterval = CACurrentMediaTime()
|
||||
|
||||
updateAnimationPhase(currentTime)
|
||||
|
||||
animationUpdate()
|
||||
|
||||
if currentTime >= _endTime
|
||||
{
|
||||
stop(finish: true)
|
||||
}
|
||||
}
|
||||
|
||||
internal func animationUpdate()
|
||||
{
|
||||
// Override this
|
||||
}
|
||||
|
||||
internal func animationEnd()
|
||||
{
|
||||
// Override this
|
||||
}
|
||||
}
|
||||
96
Pods/Charts/Source/Charts/Jobs/AnimatedZoomViewJob.swift
generated
Normal file
96
Pods/Charts/Source/Charts/Jobs/AnimatedZoomViewJob.swift
generated
Normal file
@@ -0,0 +1,96 @@
|
||||
//
|
||||
// AnimatedZoomViewJob.swift
|
||||
// Charts
|
||||
//
|
||||
// Copyright 2015 Daniel Cohen Gindi & Philipp Jahoda
|
||||
// A port of MPAndroidChart for iOS
|
||||
// Licensed under Apache License 2.0
|
||||
//
|
||||
// https://github.com/danielgindi/Charts
|
||||
//
|
||||
|
||||
import Foundation
|
||||
import CoreGraphics
|
||||
|
||||
open class AnimatedZoomViewJob: AnimatedViewPortJob
|
||||
{
|
||||
internal var yAxis: YAxis?
|
||||
internal var xAxisRange: Double = 0.0
|
||||
internal var scaleX: CGFloat = 0.0
|
||||
internal var scaleY: CGFloat = 0.0
|
||||
internal var zoomOriginX: CGFloat = 0.0
|
||||
internal var zoomOriginY: CGFloat = 0.0
|
||||
internal var zoomCenterX: CGFloat = 0.0
|
||||
internal var zoomCenterY: CGFloat = 0.0
|
||||
|
||||
@objc public init(
|
||||
viewPortHandler: ViewPortHandler,
|
||||
transformer: Transformer,
|
||||
view: ChartViewBase,
|
||||
yAxis: YAxis,
|
||||
xAxisRange: Double,
|
||||
scaleX: CGFloat,
|
||||
scaleY: CGFloat,
|
||||
xOrigin: CGFloat,
|
||||
yOrigin: CGFloat,
|
||||
zoomCenterX: CGFloat,
|
||||
zoomCenterY: CGFloat,
|
||||
zoomOriginX: CGFloat,
|
||||
zoomOriginY: CGFloat,
|
||||
duration: TimeInterval,
|
||||
easing: ChartEasingFunctionBlock?)
|
||||
{
|
||||
super.init(viewPortHandler: viewPortHandler,
|
||||
xValue: 0.0,
|
||||
yValue: 0.0,
|
||||
transformer: transformer,
|
||||
view: view,
|
||||
xOrigin: xOrigin,
|
||||
yOrigin: yOrigin,
|
||||
duration: duration,
|
||||
easing: easing)
|
||||
|
||||
self.yAxis = yAxis
|
||||
self.xAxisRange = xAxisRange
|
||||
self.scaleX = scaleX
|
||||
self.scaleY = scaleY
|
||||
self.zoomCenterX = zoomCenterX
|
||||
self.zoomCenterY = zoomCenterY
|
||||
self.zoomOriginX = zoomOriginX
|
||||
self.zoomOriginY = zoomOriginY
|
||||
}
|
||||
|
||||
internal override func animationUpdate()
|
||||
{
|
||||
guard
|
||||
let viewPortHandler = viewPortHandler,
|
||||
let transformer = transformer,
|
||||
let view = view
|
||||
else { return }
|
||||
|
||||
let scaleX = xOrigin + (self.scaleX - xOrigin) * phase
|
||||
let scaleY = yOrigin + (self.scaleY - yOrigin) * phase
|
||||
|
||||
var matrix = viewPortHandler.setZoom(scaleX: scaleX, scaleY: scaleY)
|
||||
viewPortHandler.refresh(newMatrix: matrix, chart: view, invalidate: false)
|
||||
|
||||
let valsInView = CGFloat(yAxis?.axisRange ?? 0.0) / viewPortHandler.scaleY
|
||||
let xsInView = CGFloat(xAxisRange) / viewPortHandler.scaleX
|
||||
|
||||
var pt = CGPoint(
|
||||
x: zoomOriginX + ((zoomCenterX - xsInView / 2.0) - zoomOriginX) * phase,
|
||||
y: zoomOriginY + ((zoomCenterY + valsInView / 2.0) - zoomOriginY) * phase
|
||||
)
|
||||
|
||||
transformer.pointValueToPixel(&pt)
|
||||
|
||||
matrix = viewPortHandler.translate(pt: pt)
|
||||
viewPortHandler.refresh(newMatrix: matrix, chart: view, invalidate: true)
|
||||
}
|
||||
|
||||
internal override func animationEnd()
|
||||
{
|
||||
(view as? BarLineChartViewBase)?.calculateOffsets()
|
||||
view?.setNeedsDisplay()
|
||||
}
|
||||
}
|
||||
38
Pods/Charts/Source/Charts/Jobs/MoveViewJob.swift
generated
Normal file
38
Pods/Charts/Source/Charts/Jobs/MoveViewJob.swift
generated
Normal file
@@ -0,0 +1,38 @@
|
||||
//
|
||||
// MoveViewJob.swift
|
||||
// Charts
|
||||
//
|
||||
// Copyright 2015 Daniel Cohen Gindi & Philipp Jahoda
|
||||
// A port of MPAndroidChart for iOS
|
||||
// Licensed under Apache License 2.0
|
||||
//
|
||||
// https://github.com/danielgindi/Charts
|
||||
//
|
||||
|
||||
import Foundation
|
||||
import CoreGraphics
|
||||
|
||||
#if !os(OSX)
|
||||
import UIKit
|
||||
#endif
|
||||
|
||||
@objc(MoveChartViewJob)
|
||||
open class MoveViewJob: ViewPortJob
|
||||
{
|
||||
open override func doJob()
|
||||
{
|
||||
guard
|
||||
let viewPortHandler = viewPortHandler,
|
||||
let transformer = transformer,
|
||||
let view = view
|
||||
else { return }
|
||||
|
||||
var pt = CGPoint(
|
||||
x: xValue,
|
||||
y: yValue
|
||||
)
|
||||
|
||||
transformer.pointValueToPixel(&pt)
|
||||
viewPortHandler.centerViewPort(pt: pt, chart: view)
|
||||
}
|
||||
}
|
||||
Some files were not shown because too many files have changed in this diff Show More
Reference in New Issue
Block a user